


Key Takeaways
Complete guide to implementing Toys for Tots classroom virtual leaderboards in schools. Learn how real-time donation tracking, friendly competition, and digital displays transform holiday charity drives into engaging experiences that motivate students while serving communities in need.
The Power of Gamification in School Charity Drives
Understanding why virtual leaderboards prove so effective for Toys for Tots drives requires examining how gamification principles influence student behavior and motivation in charitable contexts.
Why Traditional Charity Drives Lose Momentum
Schools have organized Toys for Tots and similar charity drives for decades using predictable approaches that often yield disappointing results despite good intentions.
Passive Collection Model: Traditional drives typically place donation boxes in central locations—main offices, cafeterias, or classroom corners—expecting students and families to remember to contribute. Without active prompts or engagement mechanisms, donation rates remain low as busy families forget about drives amid competing priorities.
Invisible Progress: When students can’t see how their contributions add up or compare to peers, individual donations feel isolated rather than part of collective effort. This invisibility fails to create momentum or build excitement as drives progress.
Delayed Recognition: Schools that announce weekly totals during Monday morning announcements provide recognition too infrequently and too far removed from donation actions to effectively reinforce behavior. By the time students hear last week’s results, the psychological connection between their contribution and acknowledged impact has weakened significantly.
Limited Competition: Traditional approaches might pit grade levels against each other, but without visible real-time tracking, competition remains abstract rather than immediately engaging. Students can’t check current standings, strategize about catching up, or experience the thrill of watching their classroom climb rankings in real-time.
Announcement Fatigue: Repeated verbal reminders about ongoing drives become background noise students tune out, particularly when the same messages repeat without new information or engaging presentation.
Research from educational psychology shows that 38.05% of students reported that competitive leaderboard elements heightened their motivation, while studies found gamified learning increases student engagement by 48% and improves knowledge retention by 36%.
How Virtual Leaderboards Transform Engagement
Digital leaderboard systems address traditional limitations while creating entirely new engagement possibilities that fundamentally change how students experience charity drives.
Real-Time Visibility: Virtual leaderboards updated throughout each day show exactly where each classroom stands in the competition at any moment. Students passing displays in hallways can instantly check rankings, creating multiple daily touchpoints that keep drives top-of-mind rather than easily forgotten.
Immediate Feedback: When classrooms submit donations and see their totals increase within minutes on public displays, the direct connection between action and visible impact provides powerful positive reinforcement. This immediate feedback loop encourages continued participation far more effectively than delayed weekly announcements.
Social Motivation: Seeing peer progress creates multiple motivational dynamics. Leading classrooms experience pride and motivation to protect their positions. Trailing classrooms develop determination to catch up. Mid-ranking classrooms strategize about realistic targets to advance. This social comparison drives participation through intrinsic competitive motivation rather than requiring constant external prompting from adults.
Narrative Arc: Well-designed leaderboards create compelling narratives as rankings shift throughout drives. Dramatic comebacks, close races, and unexpected leaders generate conversation and excitement that passive donation boxes never inspire. These evolving stories keep students engaged across multi-week collection periods.
Community Pride: Virtual leaderboards typically display school-wide donation totals alongside classroom rankings, helping students understand their individual contributions as part of larger collective impact. This combination of individual recognition and collective progress builds both classroom spirit and whole-school pride in charitable accomplishment.
According to research on classroom management tools, digital leaderboards allow teachers to provide immediate feedback to students on their performance, helping students quickly identify their strengths and weaknesses. Class rankings encourage students to set goals and actively work towards achieving them.
Understanding Toys for Tots Program Fundamentals
Before implementing leaderboard systems, schools should understand how Toys for Tots operates and align their tracking approaches with program requirements and best practices.
Toys for Tots Mission and Structure
The Marine Toys for Tots Foundation coordinates America’s premier Christmas charity program, collecting new unwrapped toys and distributing them to less fortunate children in communities nationwide.
National Coordination with Local Delivery: While the national foundation provides coordination, branding, and resources, local Marine Corps Reserve units operate individual campaigns in communities across all 50 states. Schools participating in Toys for Tots work with their local coordinators who manage collection, distribution, and community needs assessment.
New, Unwrapped Toy Focus: Toys for Tots specifically collects new, unwrapped toys appropriate for children birth through age 12 (though some campaigns extend to teenagers). This focus on new items ensures children receive quality gifts while unwrapped presentation allows local coordinators to match toys to specific children based on age appropriateness and interests.
Literacy Program Components: Beyond toys, many Toys for Tots campaigns include literacy programs distributing books to children alongside gifts. Schools can track both toy and book donations through leaderboard systems, creating multiple contribution pathways while supporting literacy missions that complement educational environments.
Timeline and Coordination: Most Toys for Tots campaigns run from October through December, culminating in distribution before Christmas. Schools planning leaderboard-driven drives should coordinate with local Marine units about collection periods, drop-off logistics, and how campaign organizers prefer donations organized and counted.
Programs like school community engagement initiatives demonstrate how schools can leverage recognition technology to celebrate charitable participation while building culture around service and contribution.
Establishing Drive Goals and Parameters
Successful leaderboard-driven Toys for Tots drives require clear planning about what you’re tracking, how you’re measuring progress, and what outcomes you’re pursuing.
Defining Competition Units: Schools must decide whether leaderboards track individual students, homeroom classrooms, grade levels, academic departments, or some combination. Most elementary and middle schools find homeroom-based competition works well since students identify strongly with these groups and teachers can easily coordinate participation. High schools might track by grade level or advisory groups depending on structure.
Measurement Approaches: Virtual leaderboards can track donations several ways, each with distinct advantages:
Item Count: Simply counting the number of toys donated provides straightforward measurement everyone understands. However, item counting doesn’t differentiate between inexpensive small toys and substantial donations.
Dollar Value: Assigning approximate values to donations creates more nuanced recognition of contribution scale. However, value-based tracking requires staff time for assessment and may discourage families concerned about donation costs rather than participation spirit.
Point Systems: Assigning points for different contribution types creates flexibility. Schools might award base points per item plus bonus points for particularly needed items (infant toys, books, games for older children). Point systems allow creative approaches like doubling points during specific periods to boost momentum.
Goal Setting: Establish specific drive goals beyond abstract “collect as many toys as possible.” Concrete targets create clear success measures and allow celebrating achievement when communities reach ambitious but realistic milestones. Goals might include:
- Total toy count (e.g., 500 toys collected school-wide)
- Toys per student average (e.g., average of 2 toys per enrolled student)
- Dollar value equivalents (e.g., $5,000 worth of toys based on approximate retail values)
- Beating previous year totals by specified percentages
- Reaching regional or community impact benchmarks
Prize and Recognition Structures: Decide whether winning classrooms receive tangible rewards (ice cream party, extra recess, trophy) or purely recognition-based honors (display prominence, certificate, announcement recognition). Consider also participation recognition ensuring non-winning groups still receive acknowledgment for contribution.
Selecting Virtual Leaderboard Technology Platforms
The technology infrastructure supporting your virtual leaderboard significantly impacts ease of implementation, student engagement quality, and administrative sustainability.
Digital Display Options for School Hallways
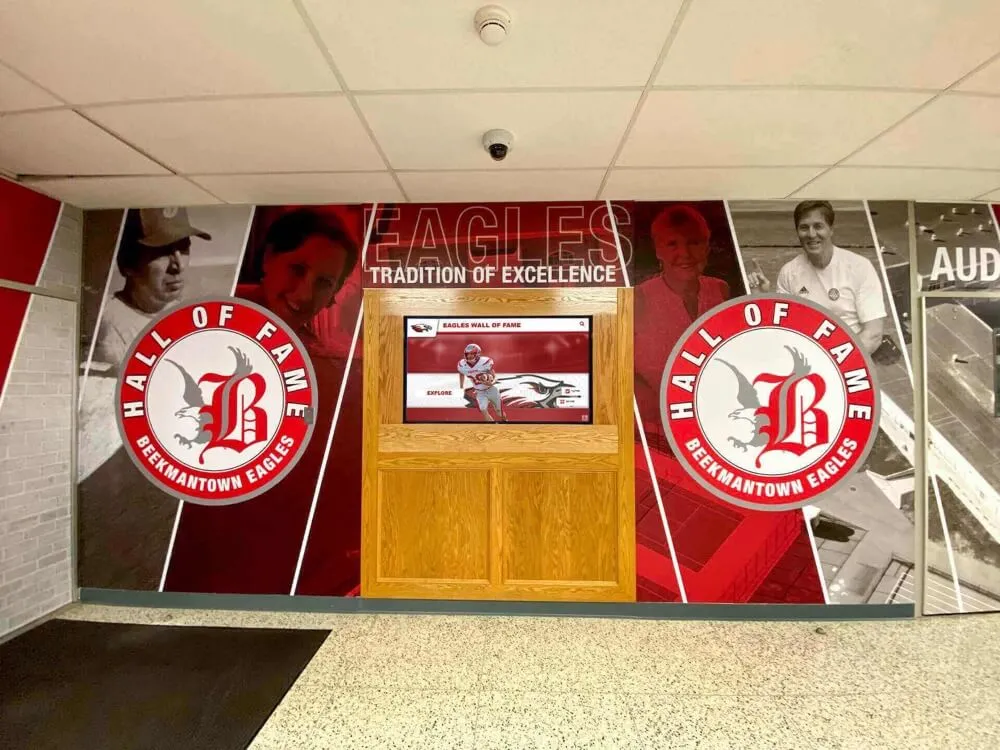
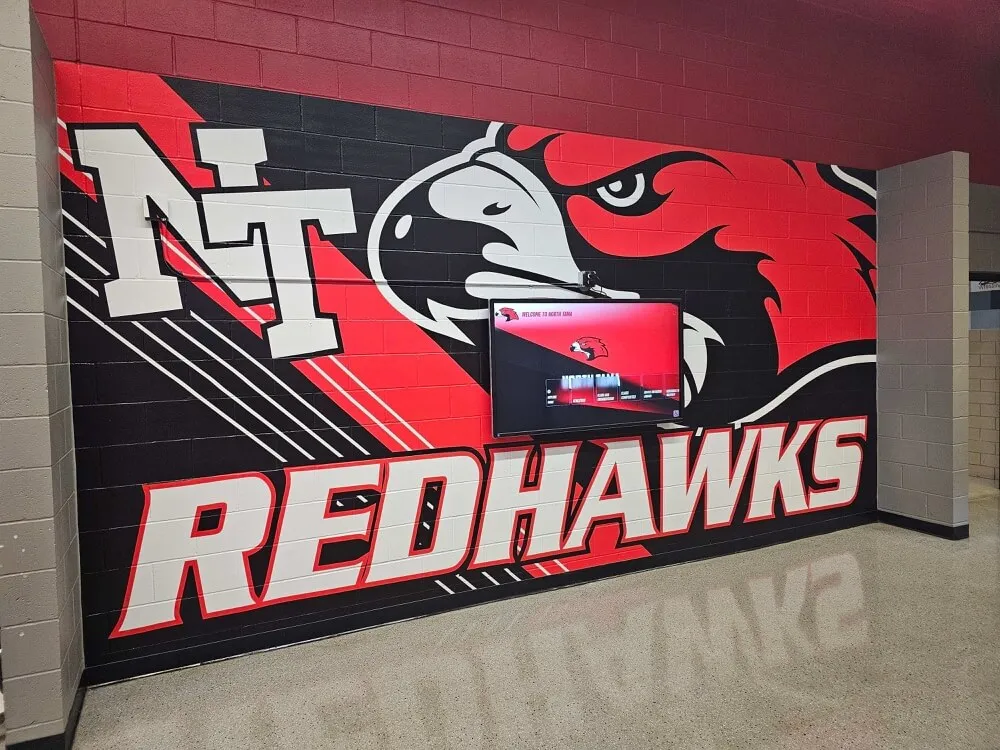
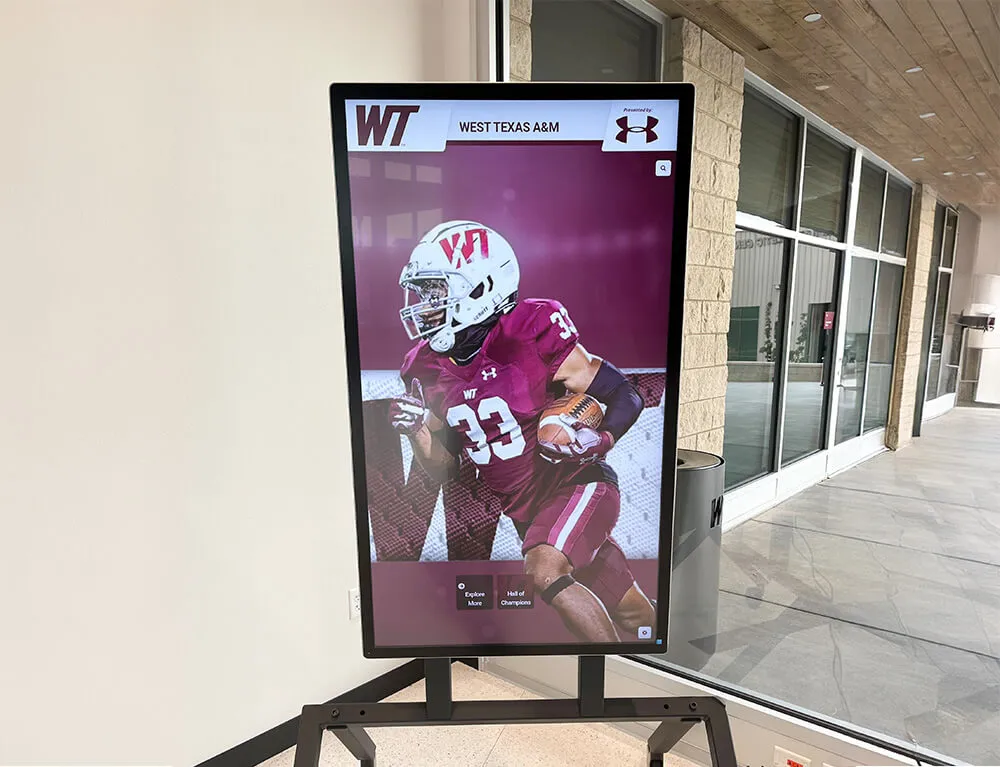
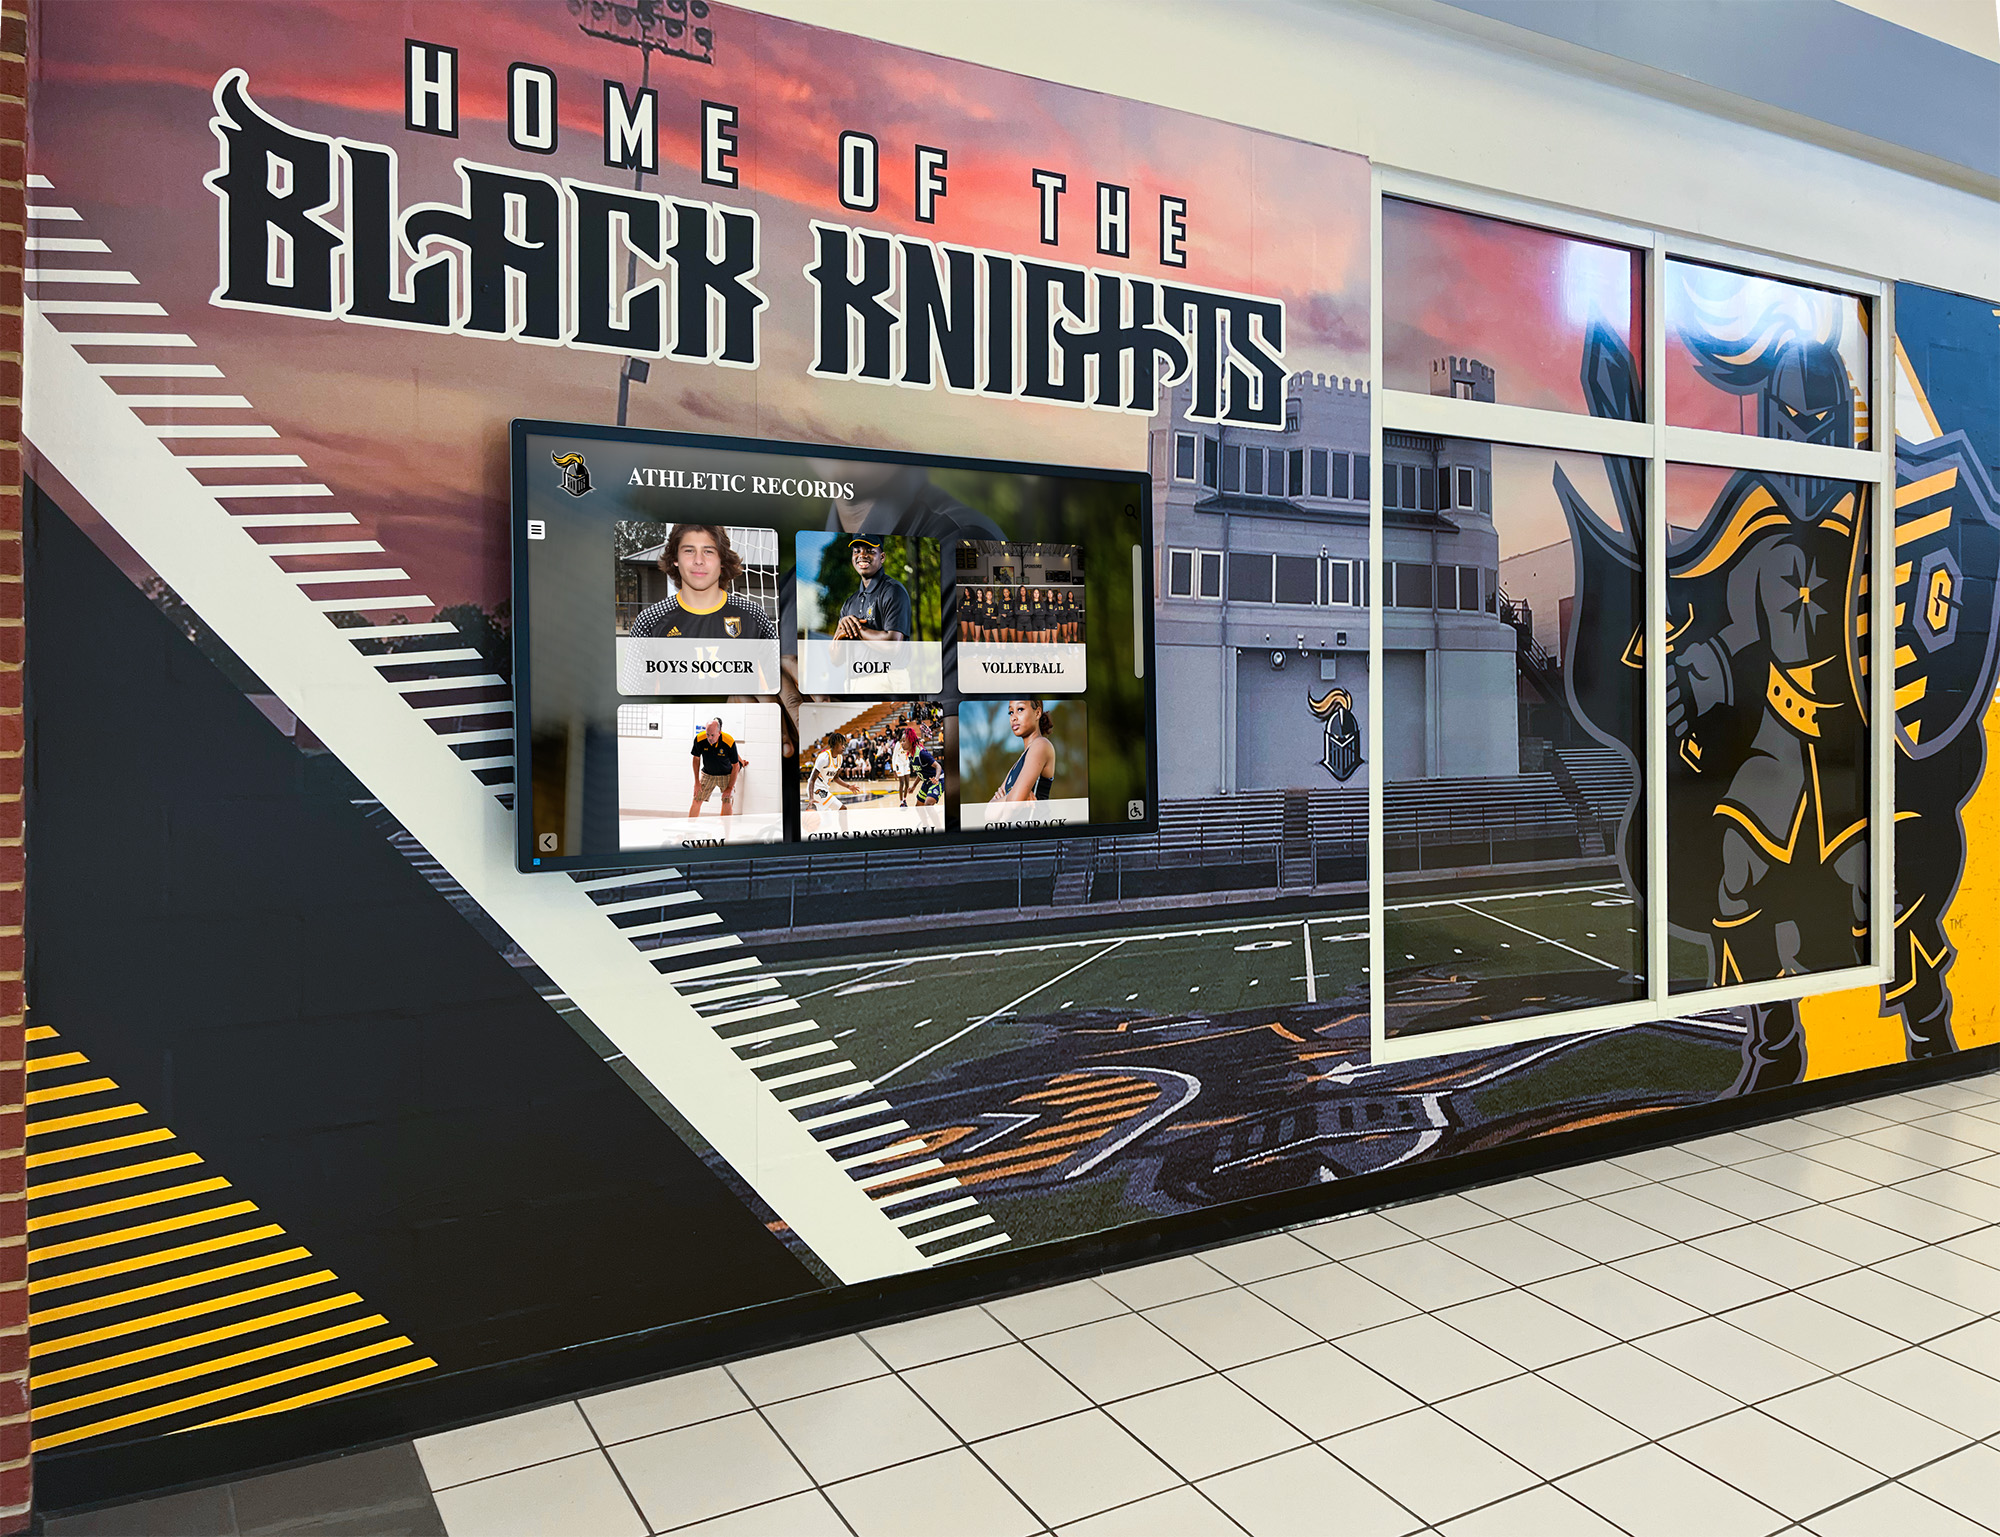
Physical displays positioned in high-traffic school locations create visible focal points that students naturally encounter multiple times daily without requiring intentional seeking.
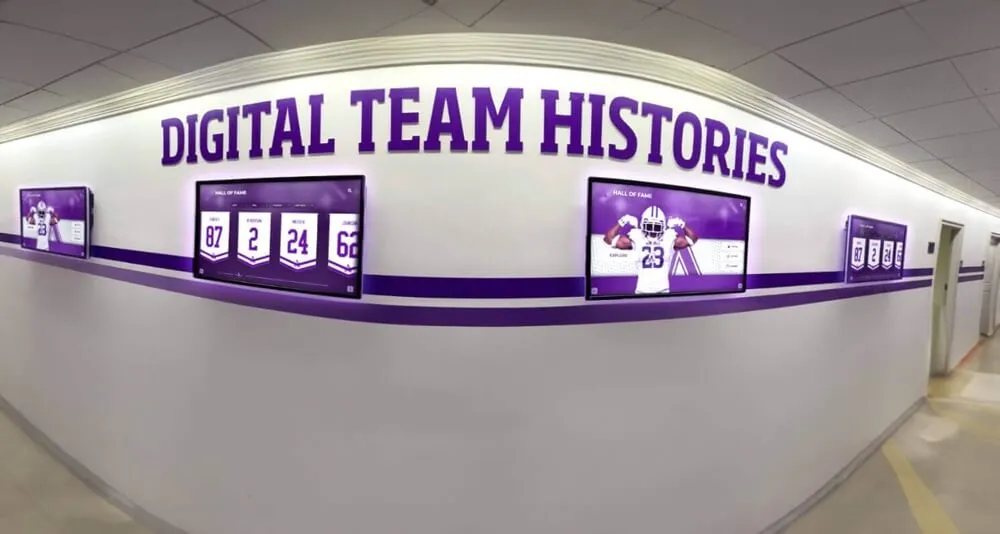
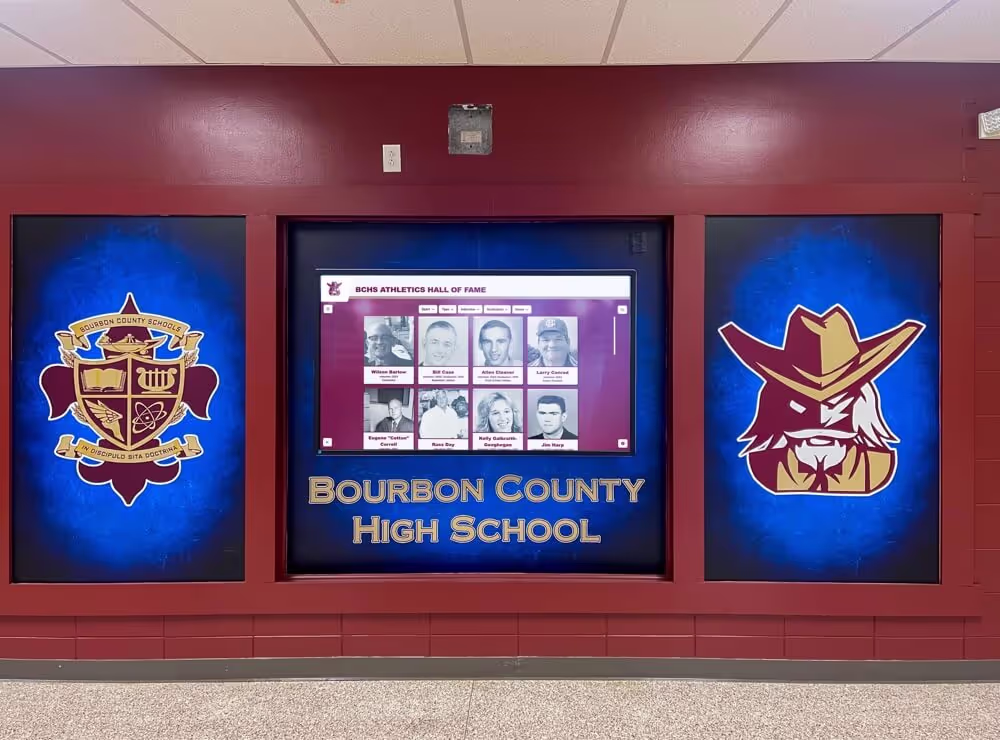
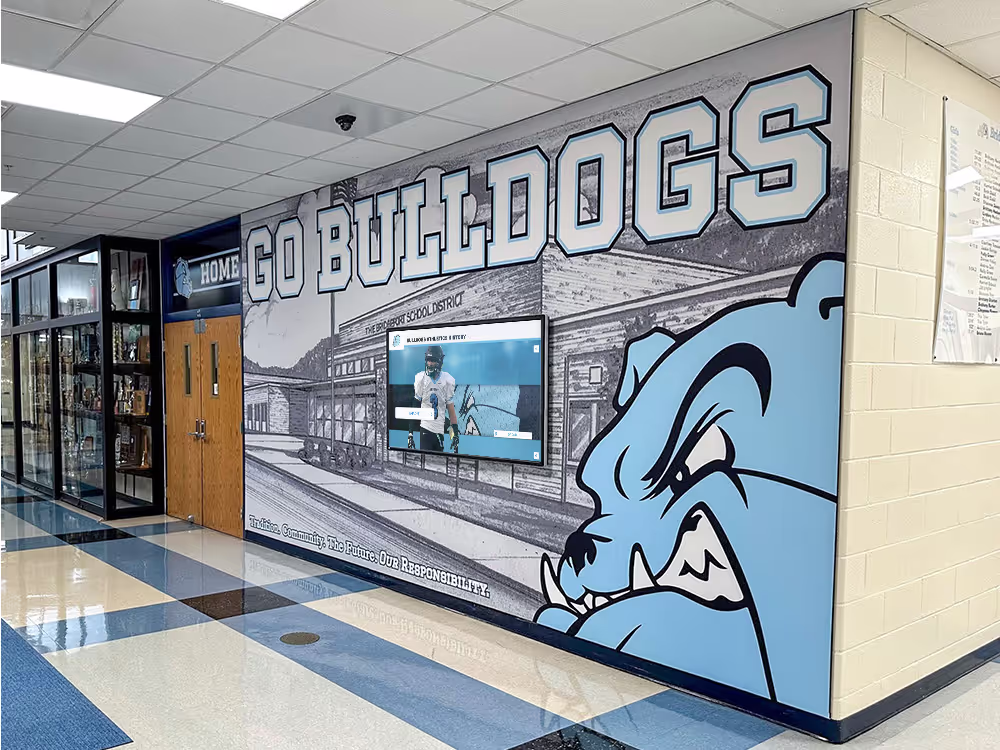
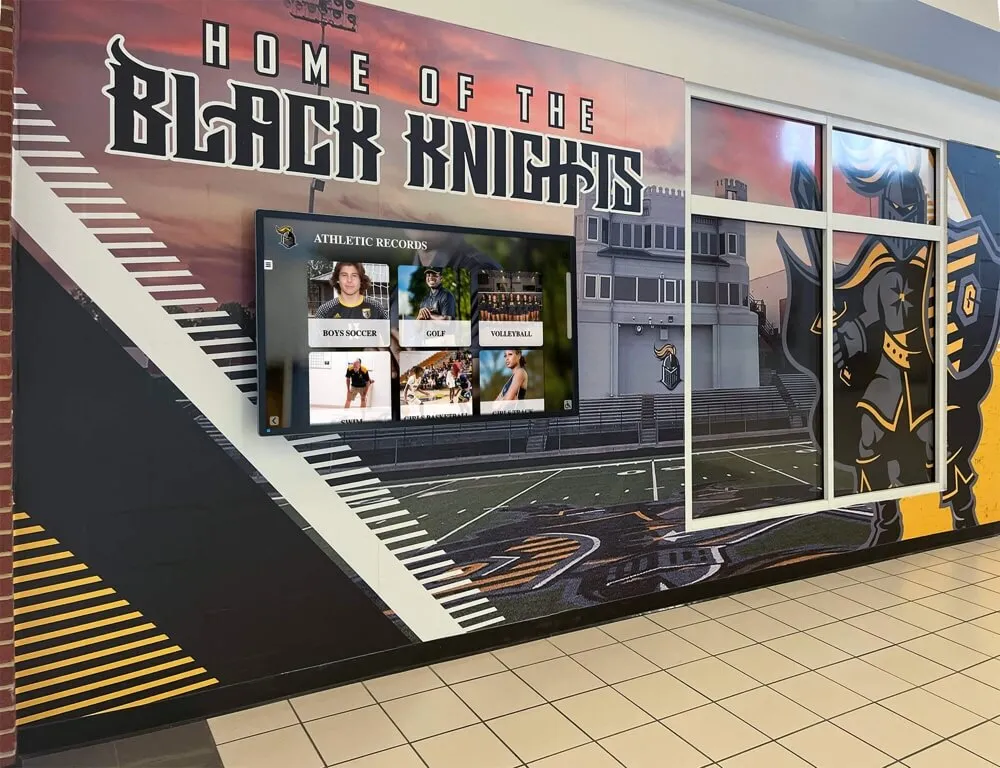
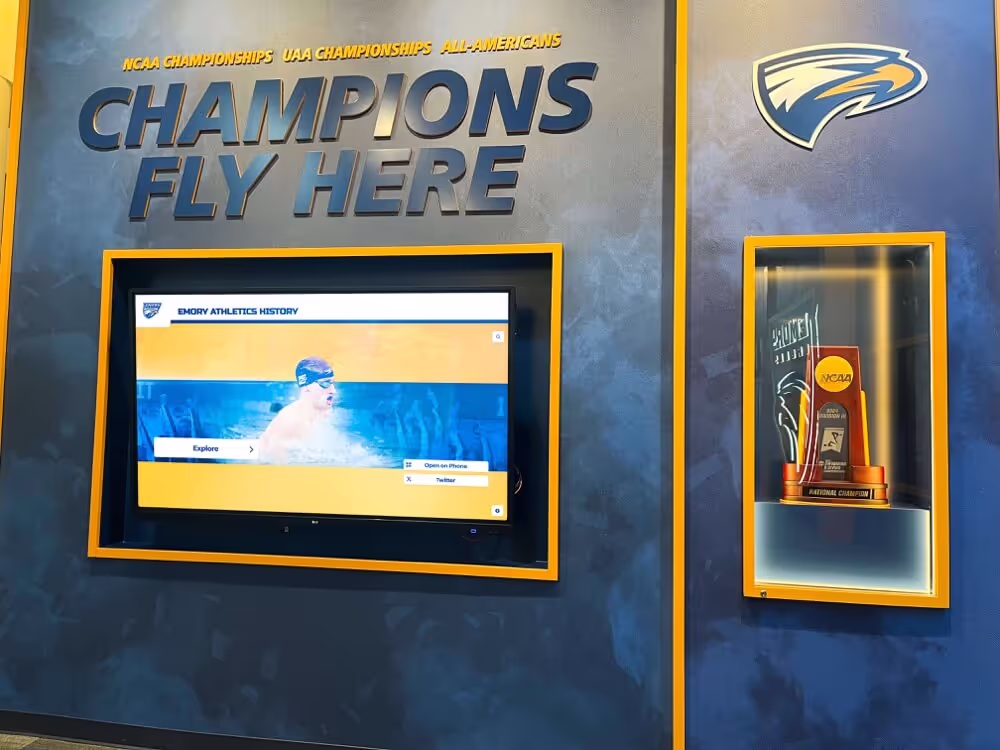
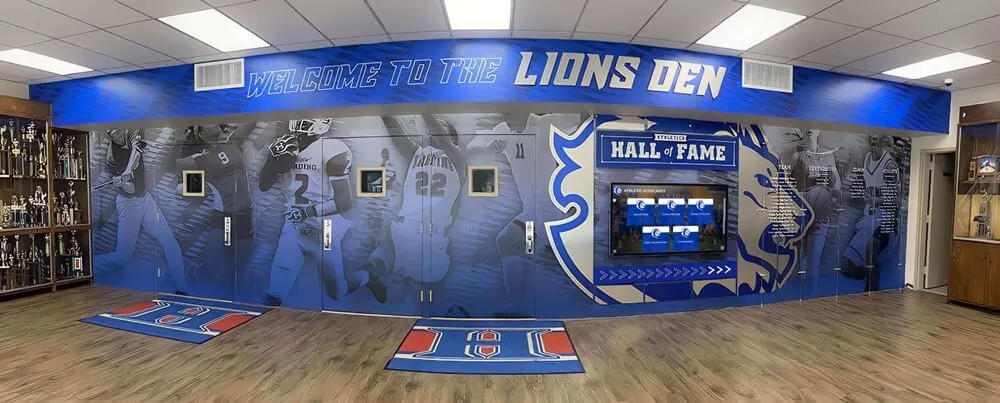
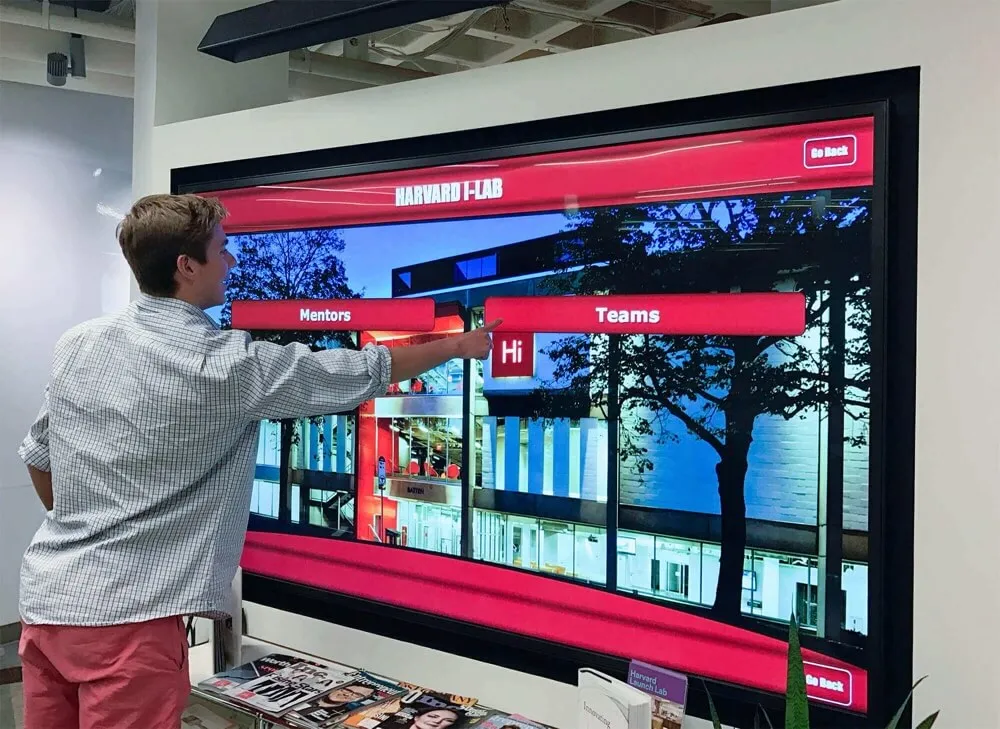
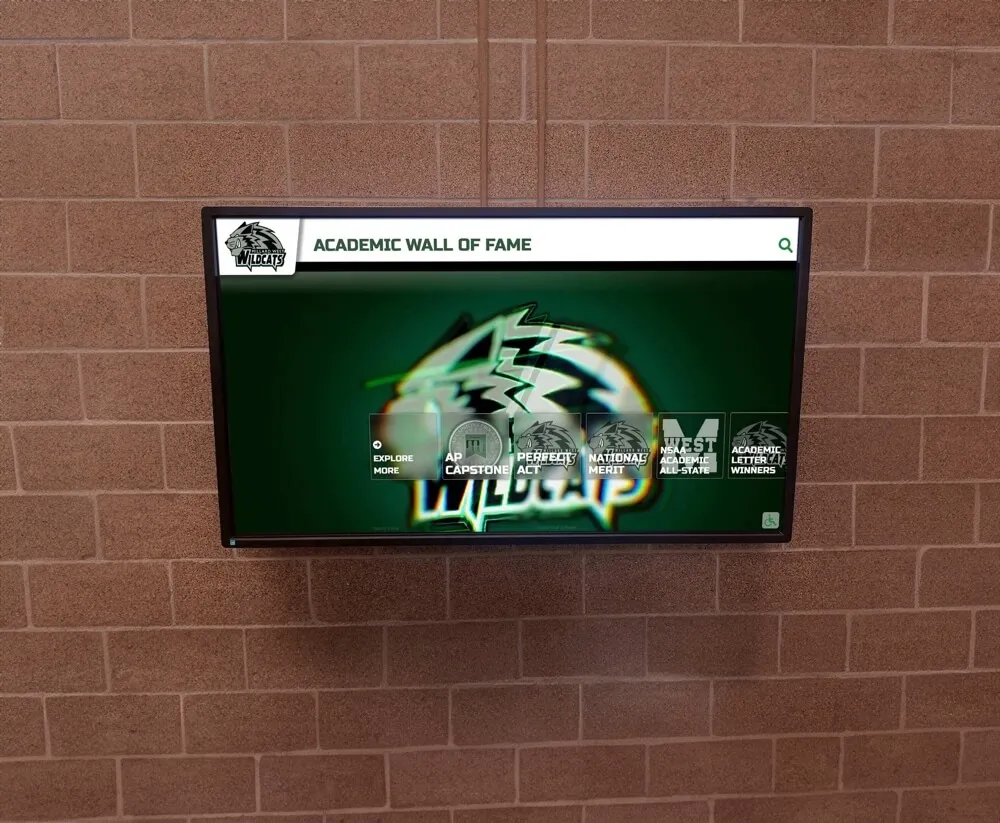
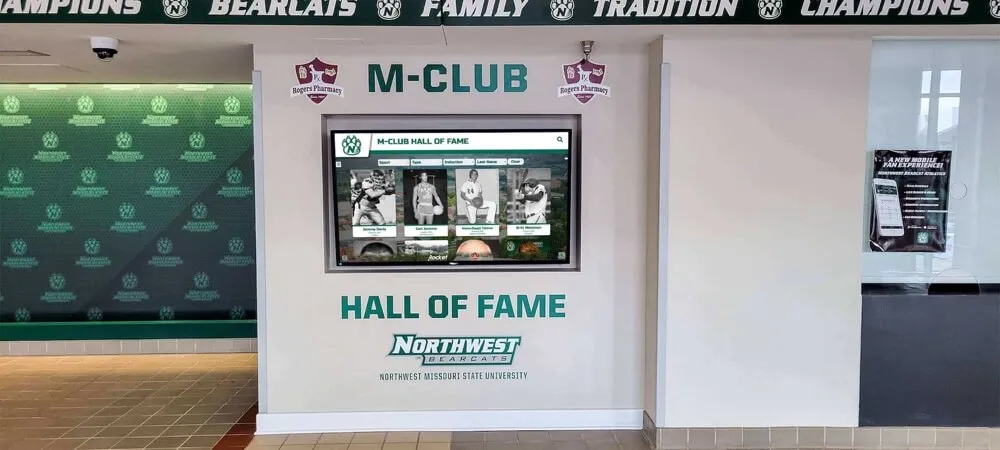
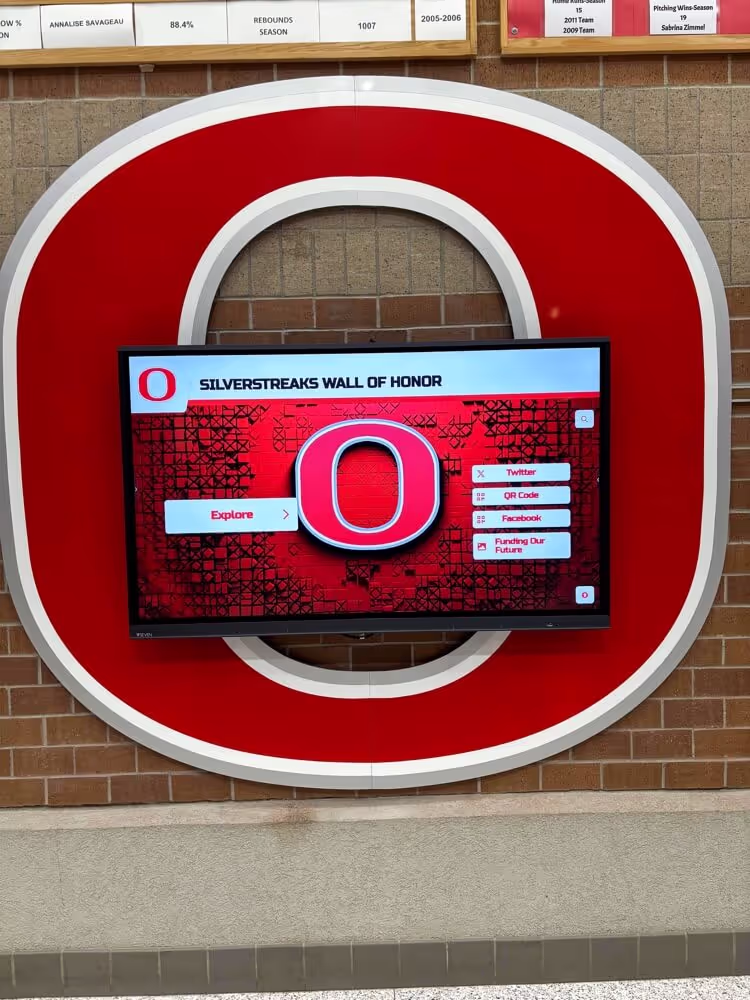
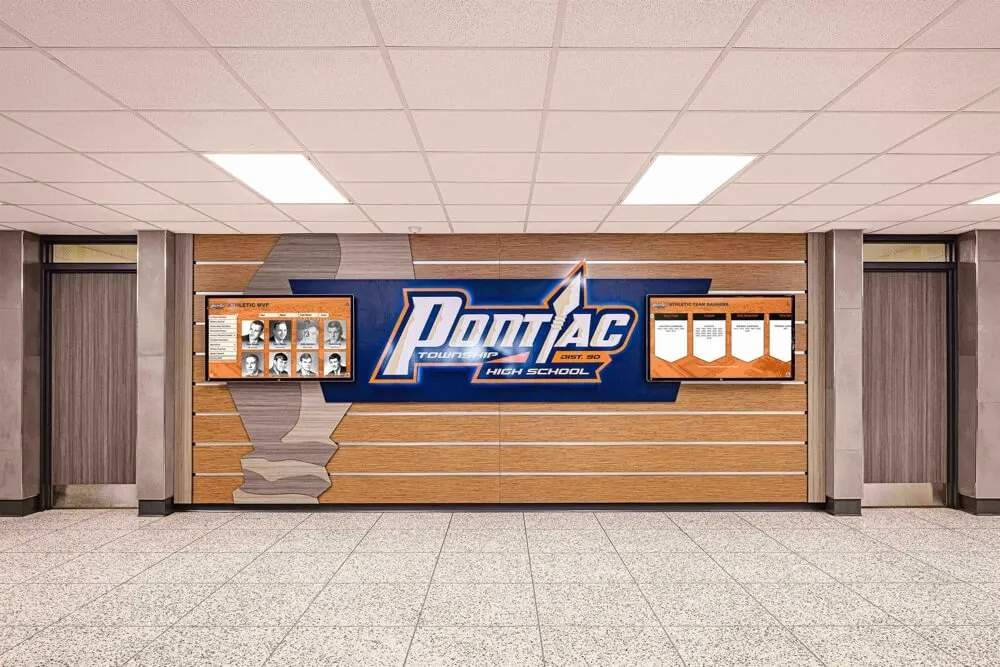
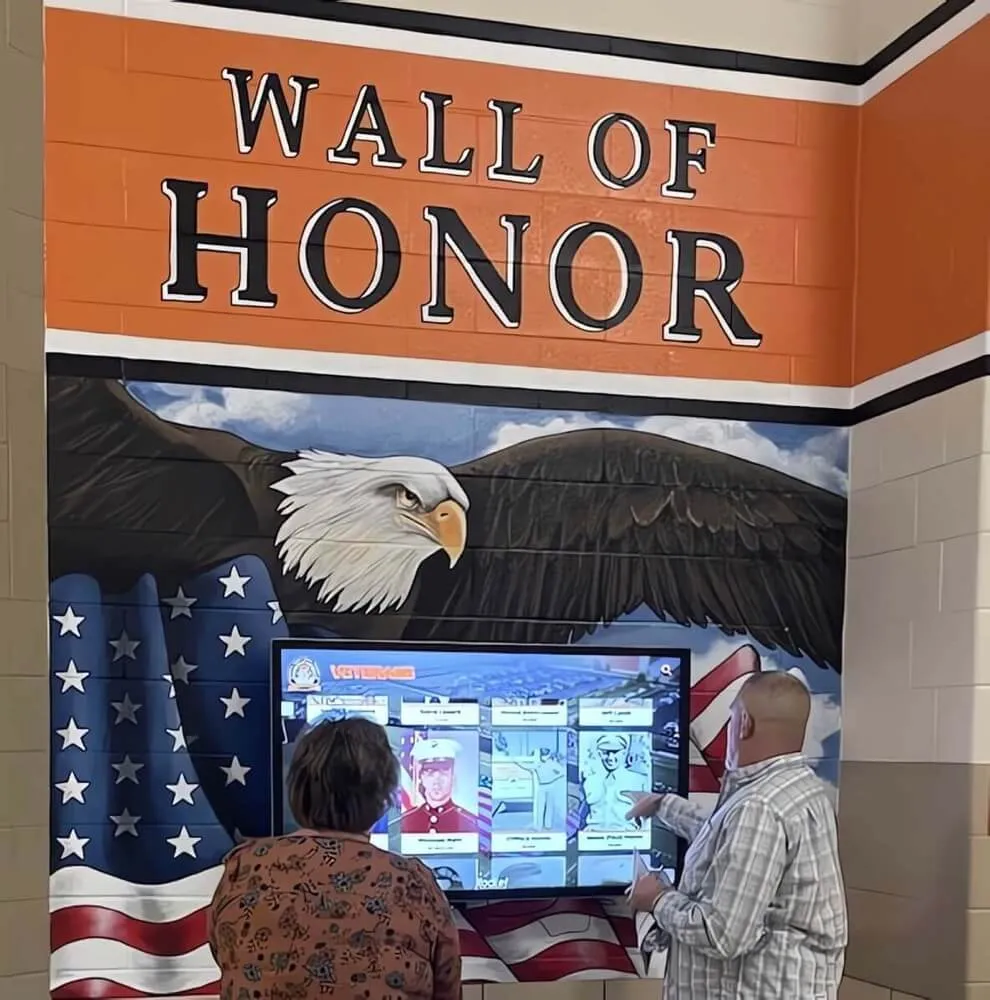
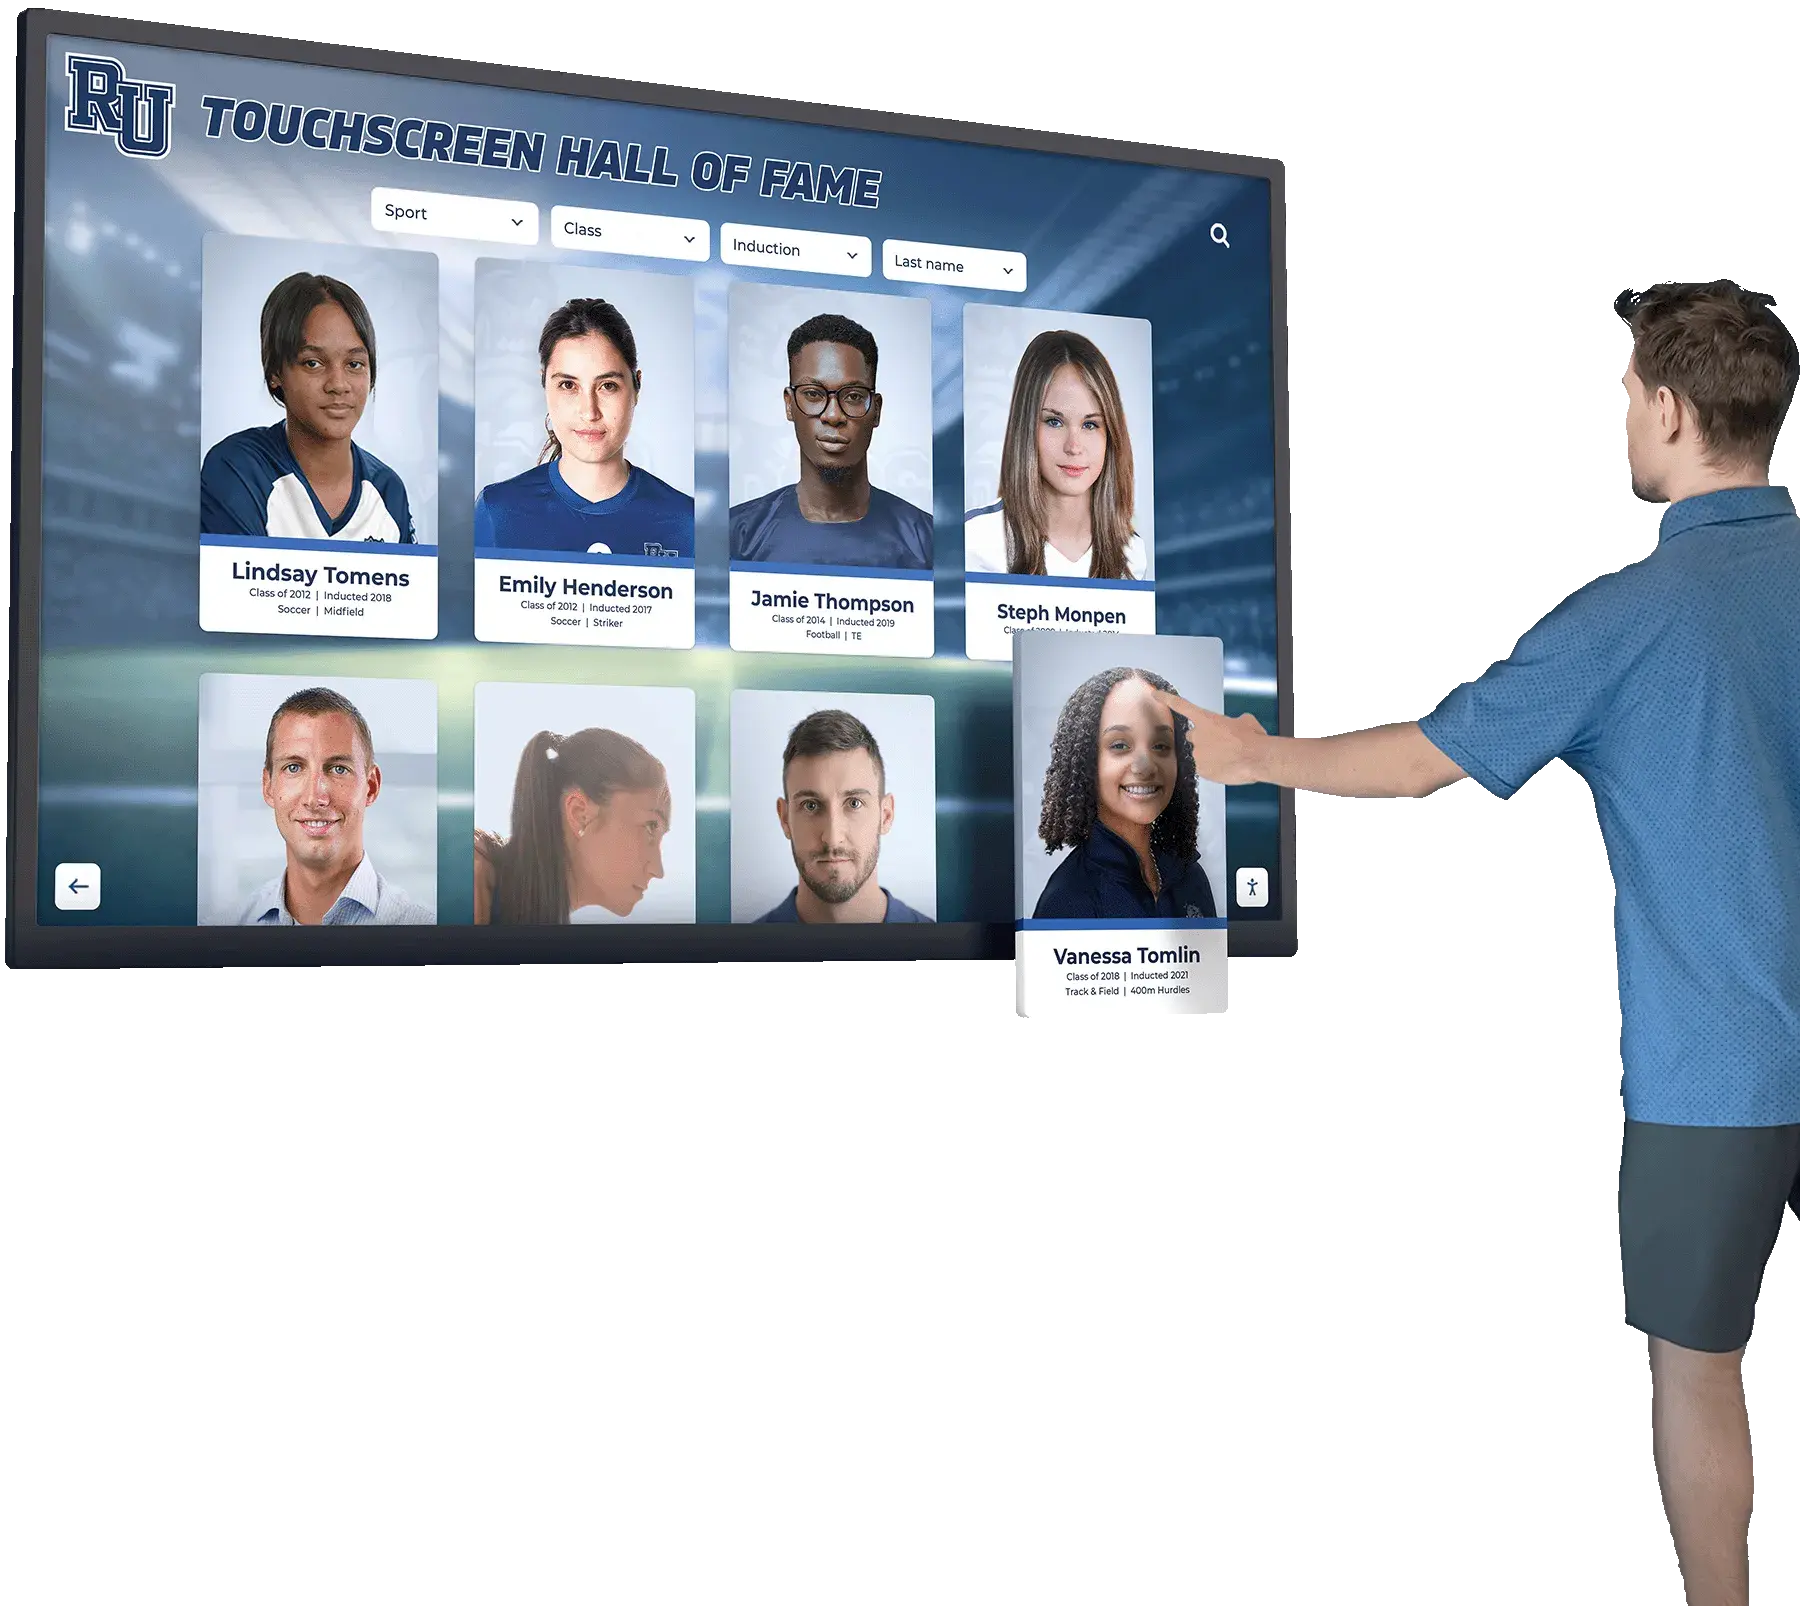
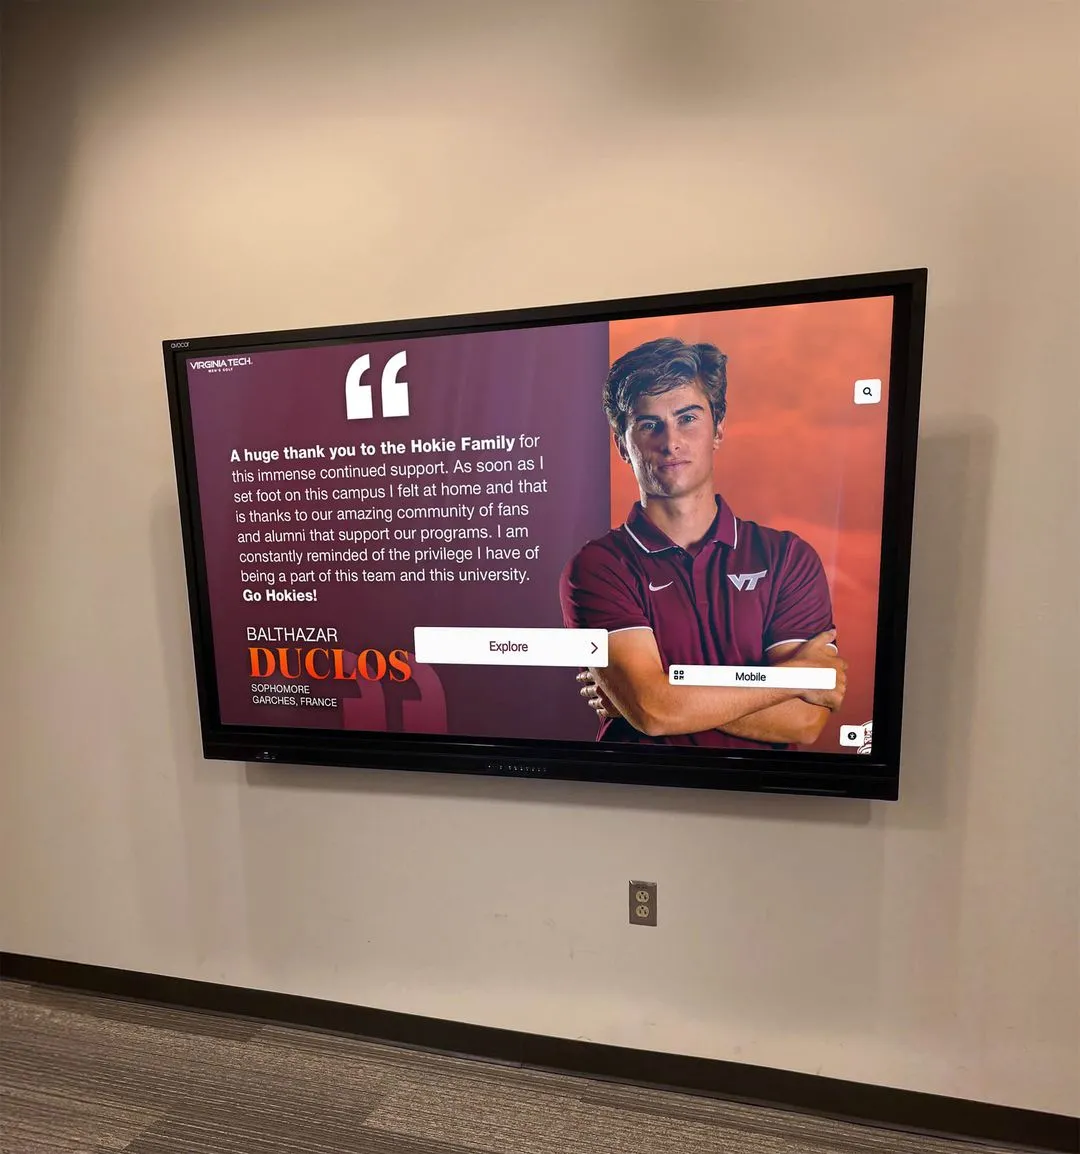
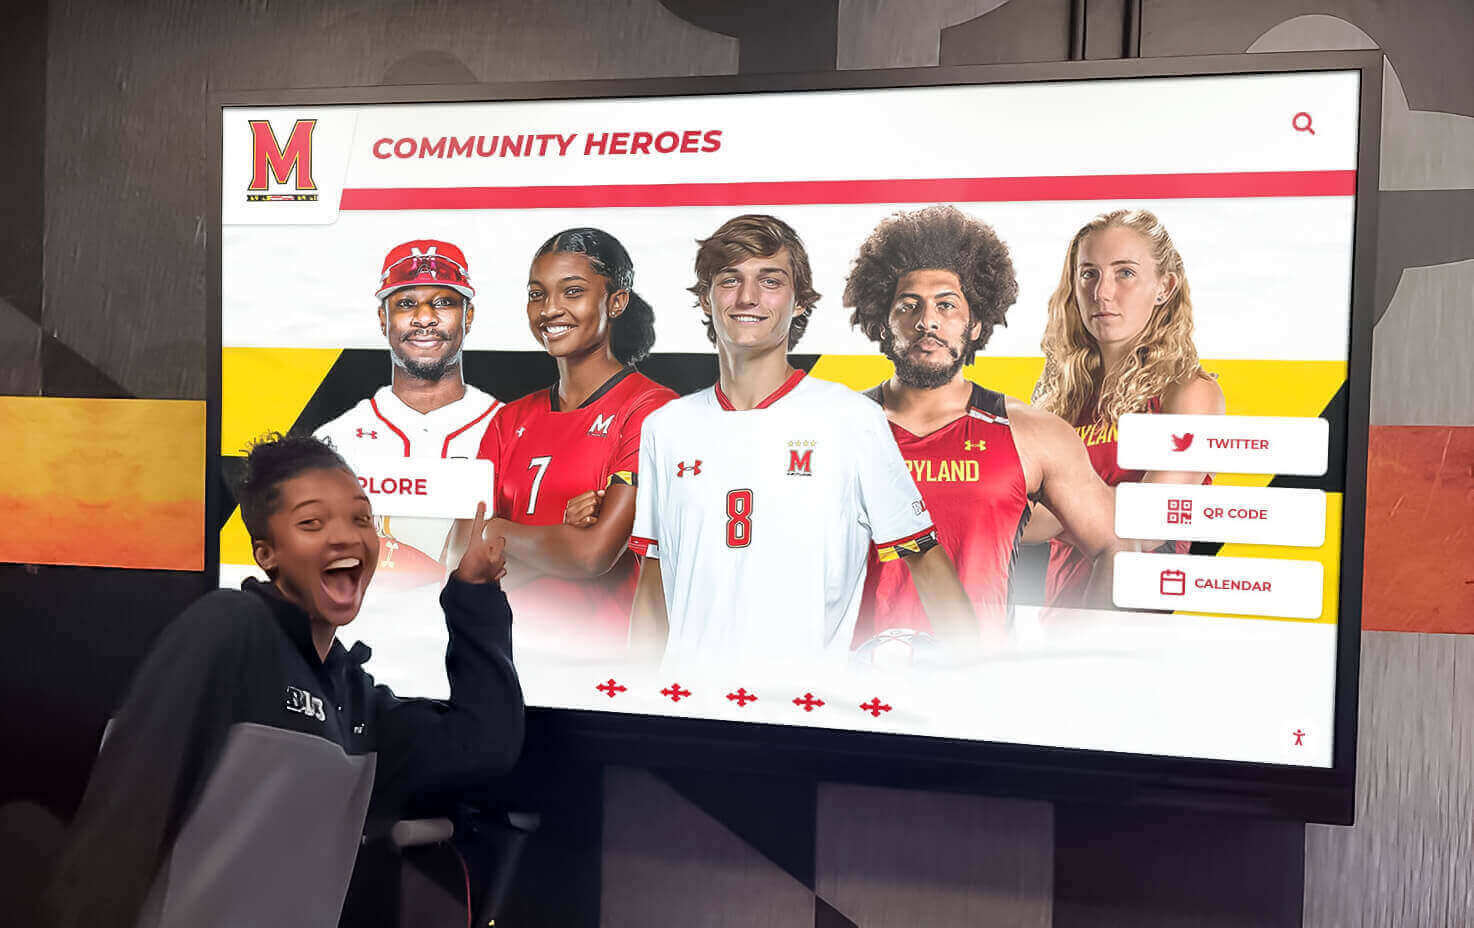
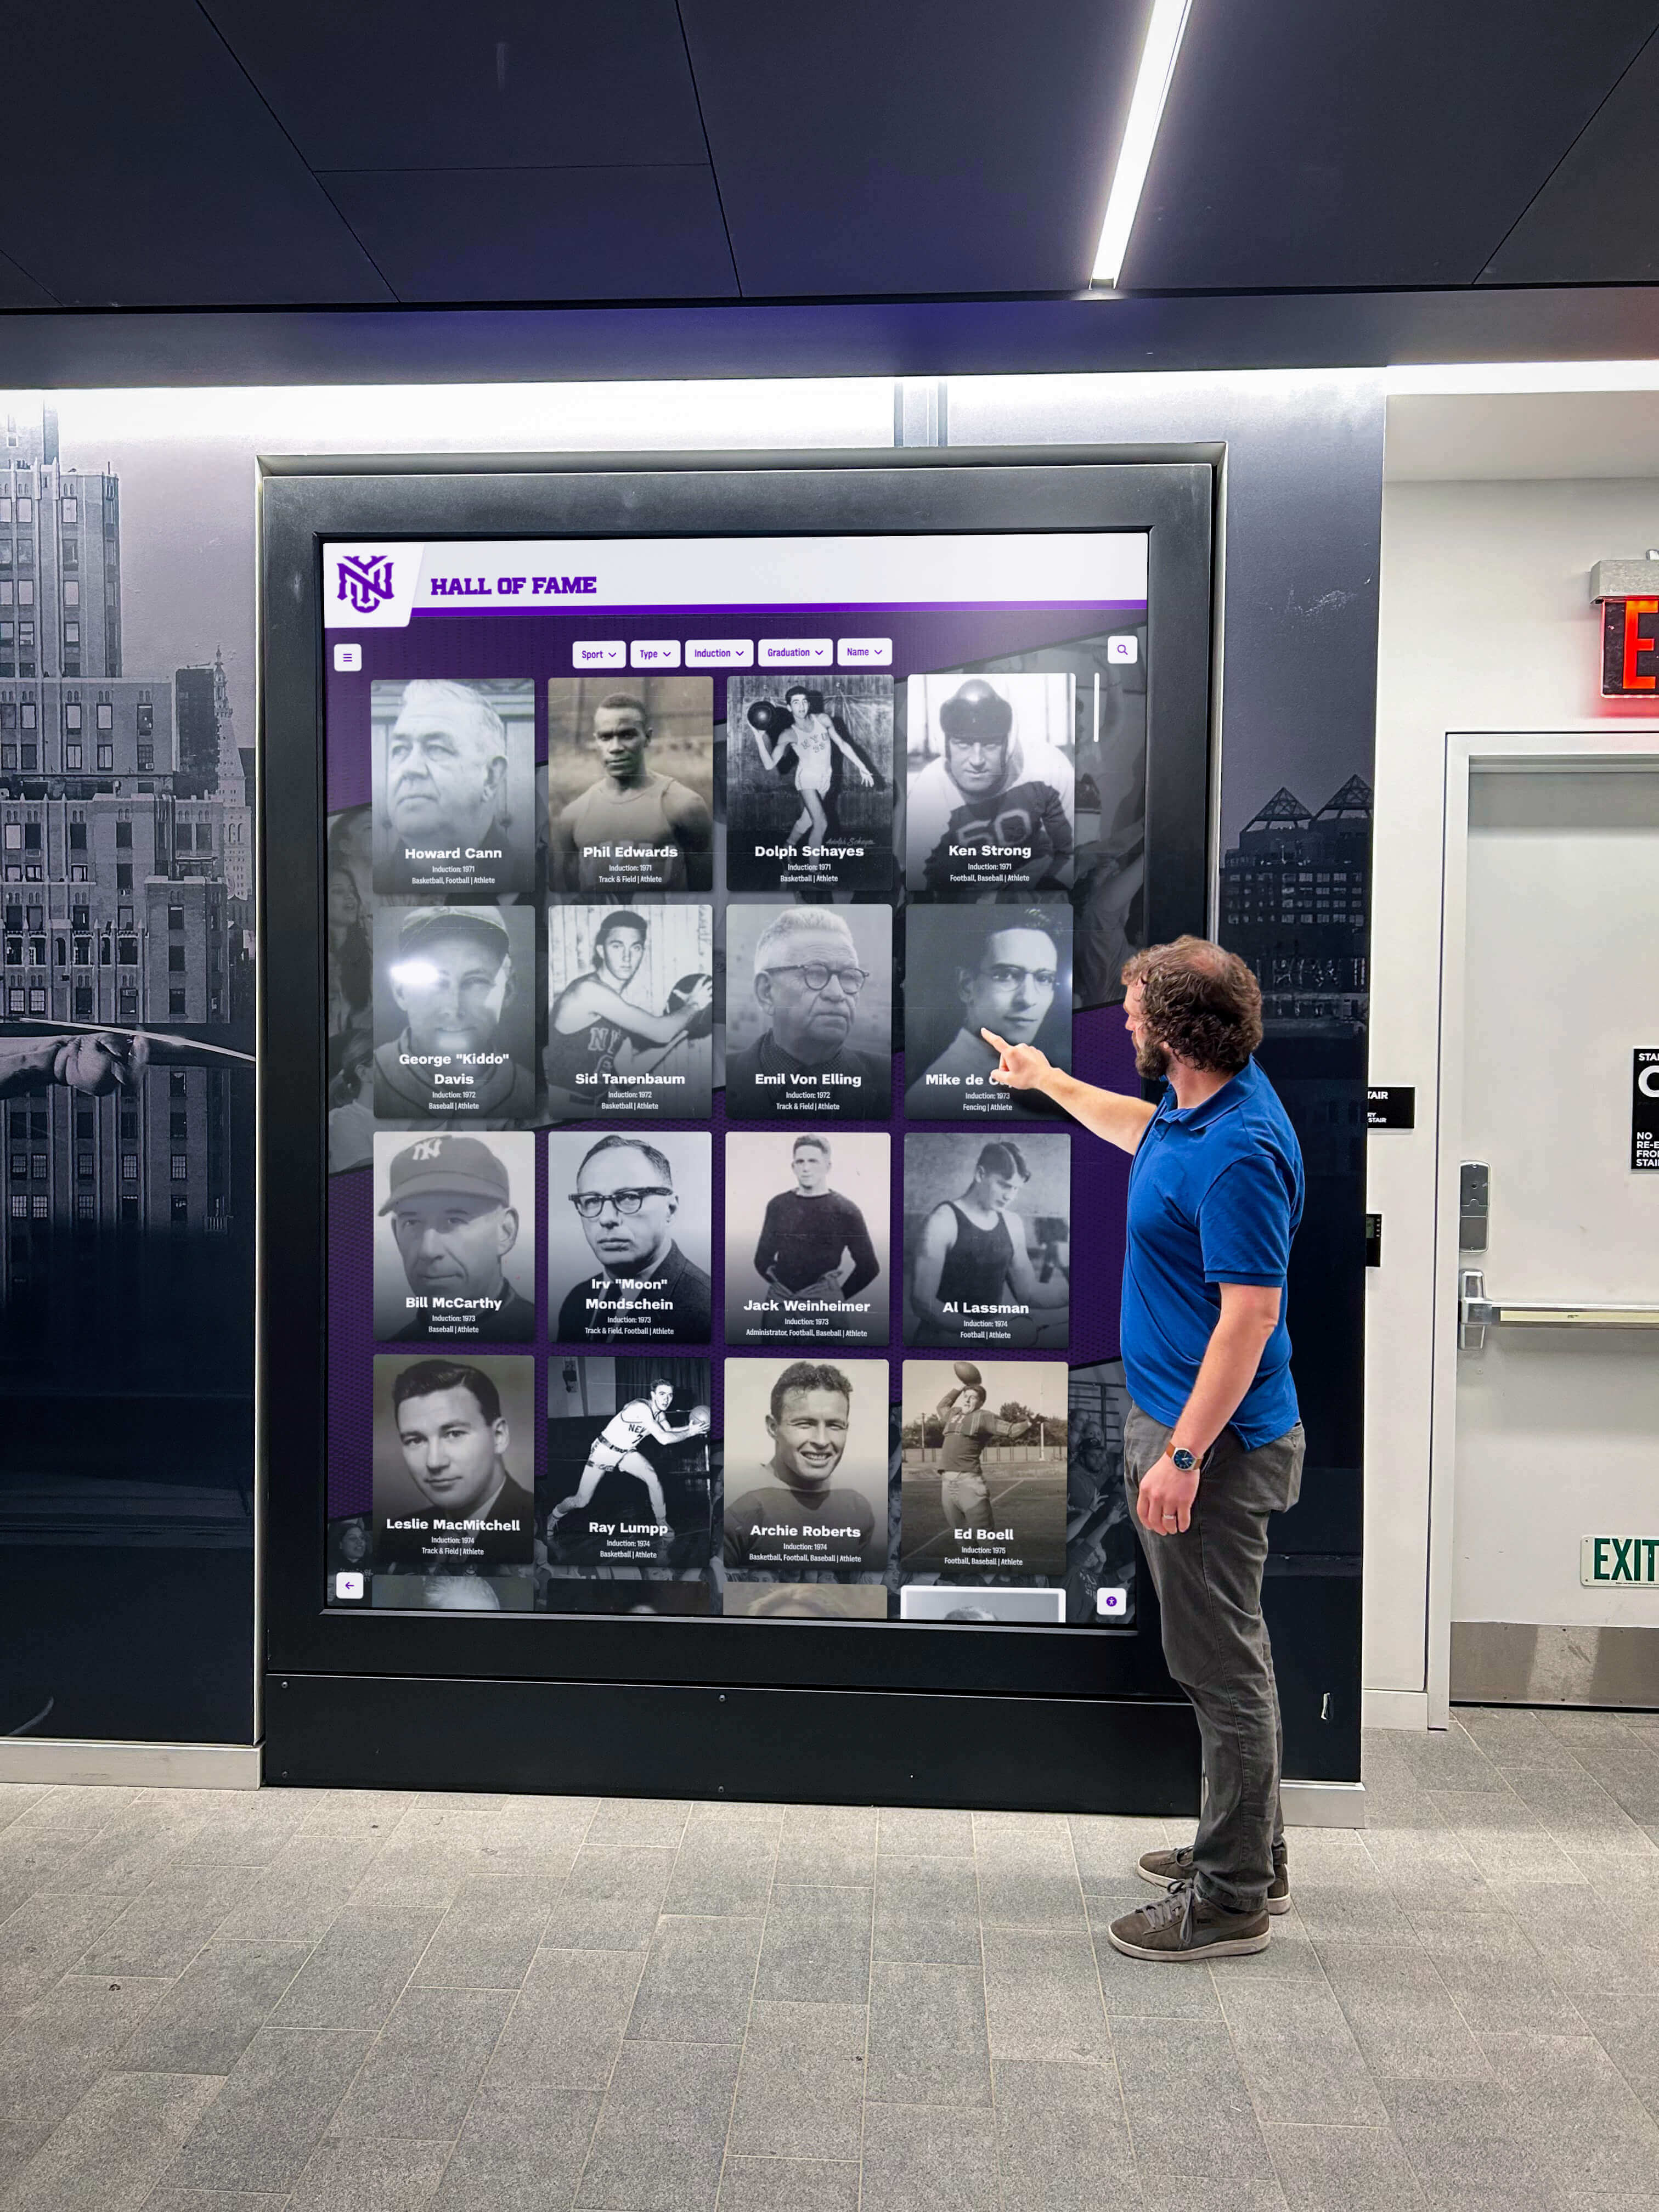
Interactive Touchscreen Displays: Large touchscreen displays mounted in main lobbies, cafeteria entrances, or hallway intersections provide premium engagement. Students can interact with displays to see detailed breakdowns, historical data, or classroom-specific information beyond headline rankings. Interactive capabilities transform leaderboards from passive viewing into active exploration.
Professional-grade touchscreen displays typically range from 55 to 75 inches, providing sufficient size for hallway visibility while fitting standard mounting locations. Solutions like digital recognition displays designed for schools offer turnkey platforms specifically designed for educational environments with intuitive content management systems that teachers can update without technical expertise.
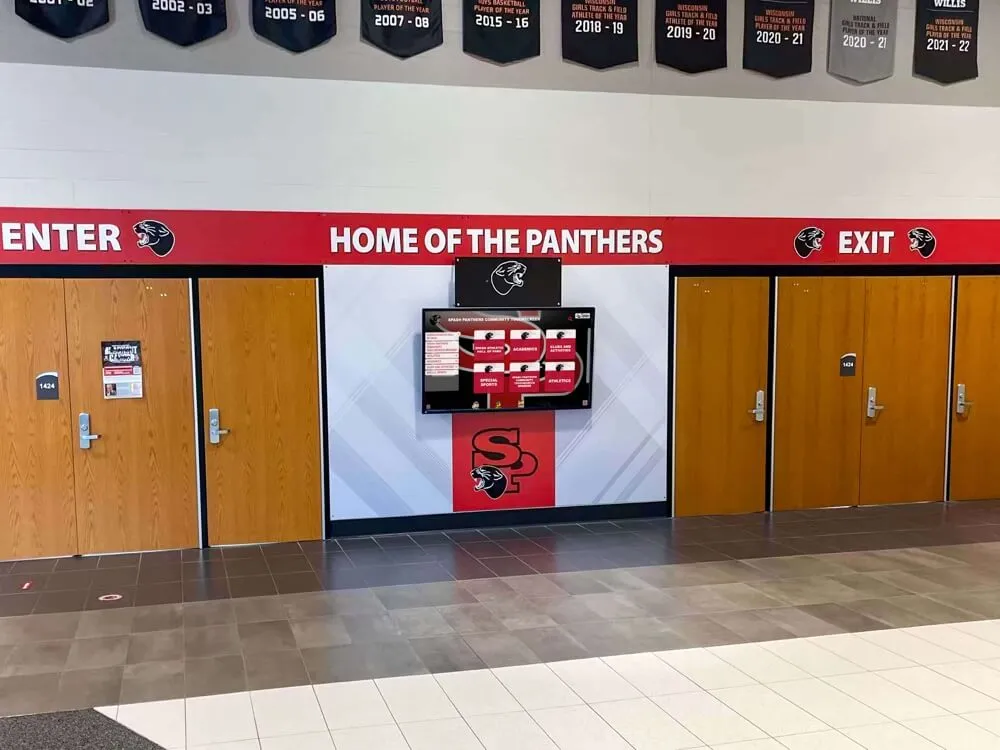
Digital Signage Screens: Non-interactive digital signage displays cost significantly less than touchscreen systems while still providing dynamic content capabilities far exceeding static bulletin boards. Digital signage automatically rotates through leaderboard content, announcements, and other information, ensuring regular Toys for Tots visibility without constant manual intervention.
These displays typically cost $2,000 to $5,000 installed compared to $6,500 to $15,000 for interactive touchscreens. For budget-conscious schools wanting to test virtual leaderboard approaches before larger investments, digital signage offers middle-ground options proving concept before committing to premium systems.
Repurposed Existing Displays: Many schools already have digital displays installed for announcements, lunch menus, or general communication. These existing systems can often display leaderboard content during Toys for Tots drives, requiring no additional hardware investment—only content creation and display scheduling within existing infrastructure.
Multi-Display Networks: Larger schools benefit from leaderboards visible in multiple locations rather than requiring students to visit specific areas to check standings. Coordinated displays throughout buildings create comprehensive coverage ensuring all students regularly encounter ranking information regardless of which building areas their schedules keep them in.
Web-Based and Mobile Leaderboard Solutions
Digital leaderboards need not require physical displays. Web-based platforms provide universal access through existing computers, tablets, and smartphones without dedicated hardware investment.
Real-Time Web Dashboards: Cloud-based leaderboard platforms allow viewing from any internet-connected device—school computers, student Chromebooks or iPads, or personal smartphones. Web access dramatically expands visibility beyond physical school boundaries, enabling families to check standings from home and engage in conversations about contribution strategies.
Tools like MakeTheBoard showcase top donors and teams in real-time to create excitement and anticipation, with live tracking helping to motivate participants and encouraging friendly competition during donation drives. Their platform displays top fundraisers in real time, perfect for school fundraisers and community events.
Mobile-Responsive Design: Modern leaderboard platforms optimize viewing across device types and screen sizes. Whether viewed on large hallway displays, classroom computers, or smartphone screens, properly designed systems ensure readability and engagement regardless of access method.
Social Media Integration: Web-based platforms facilitate easy sharing to social media, enabling families to celebrate their classroom’s achievements with extended networks. This amplification extends leaderboard visibility far beyond immediate school communities while providing positive school promotion through authentic family endorsements.
Update Accessibility: Cloud-based systems allow authorized staff to update leaderboard data from anywhere rather than requiring physical presence at display locations. Teachers can submit donation counts from classrooms using smartphones or computers, streamlining data collection while ensuring timely updates that maintain leaderboard currency and relevance.
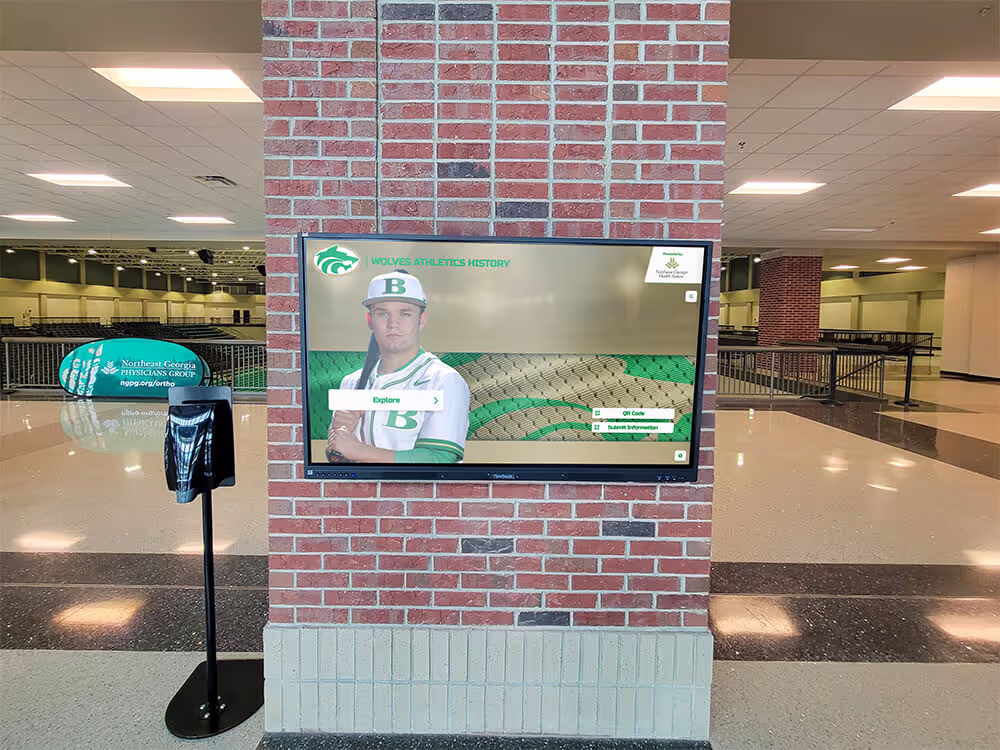
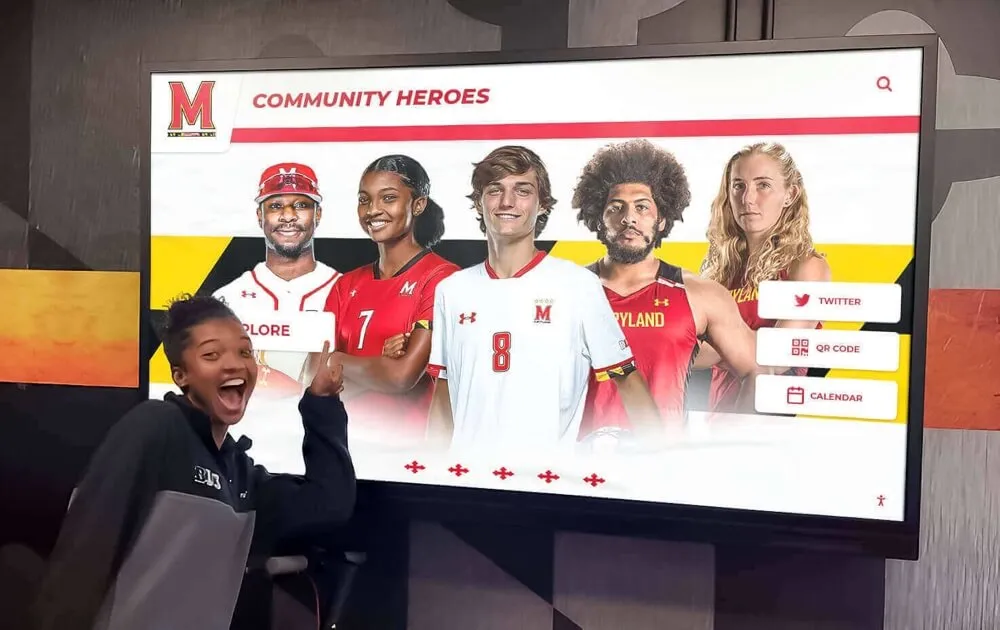
QR Code Connections: Schools can display QR codes near donation collection points linking directly to current leaderboard standings. Students dropping off donations can immediately scan codes to see updated rankings, creating instant feedback loops connecting action to visible impact.
Content Management and Data Entry Systems
Leaderboard effectiveness depends on easy, efficient data management allowing frequent updates without excessive staff burden.
Intuitive Administrative Interfaces: Staff without technical expertise should easily update leaderboards through web-based dashboards requiring no special software, spreadsheet-style data entry for classroom totals, drag-and-drop photo uploads showing donation progress, scheduled publishing for timed content changes, and preview capabilities showing exactly how content will appear before publishing.
Automated Calculation and Ranking: Effective systems automatically sort classrooms by donation totals, calculate percentage changes since last updates, generate bar charts or graphs visualizing relative performance, and highlight dramatic changes or close competitions requiring no manual computation or formatting.
Multi-User Permissions: Distributed data entry prevents bottlenecks. Grade-level teachers might enter their own classroom totals, coordinators approve and publish updates, administrators access comprehensive analytics, and student council representatives potentially contribute content like photos or motivational messages depending on school approach.
Historical Tracking: Systems should maintain complete historical data showing daily progress throughout drives. Historical tracking enables interesting visualizations like line graphs showing ranking evolution over time, identification of momentum patterns (which classrooms started strong vs. finished strong), and comparison to previous years’ performance for context.
Integration Capabilities: Advanced platforms integrate with existing school systems—student information systems providing enrollment data for per-capita calculations, communication platforms for automated notification when leaderboards update, and social media for automated posting of major milestones or daily updates.
Schools implementing comprehensive digital recognition systems find that platforms designed specifically for educational contexts provide better user experiences and less administrative burden than generic corporate digital signage or fundraising tools not optimized for school environments.
Designing Compelling Leaderboard Content and Displays
Technology platforms enable tracking and display, but content quality determines whether leaderboards genuinely capture student attention and motivate participation versus becoming background noise students ignore.
Visual Design Principles for Maximum Impact
Effective leaderboard displays balance information clarity with visual appeal that captures attention in busy hallway environments.
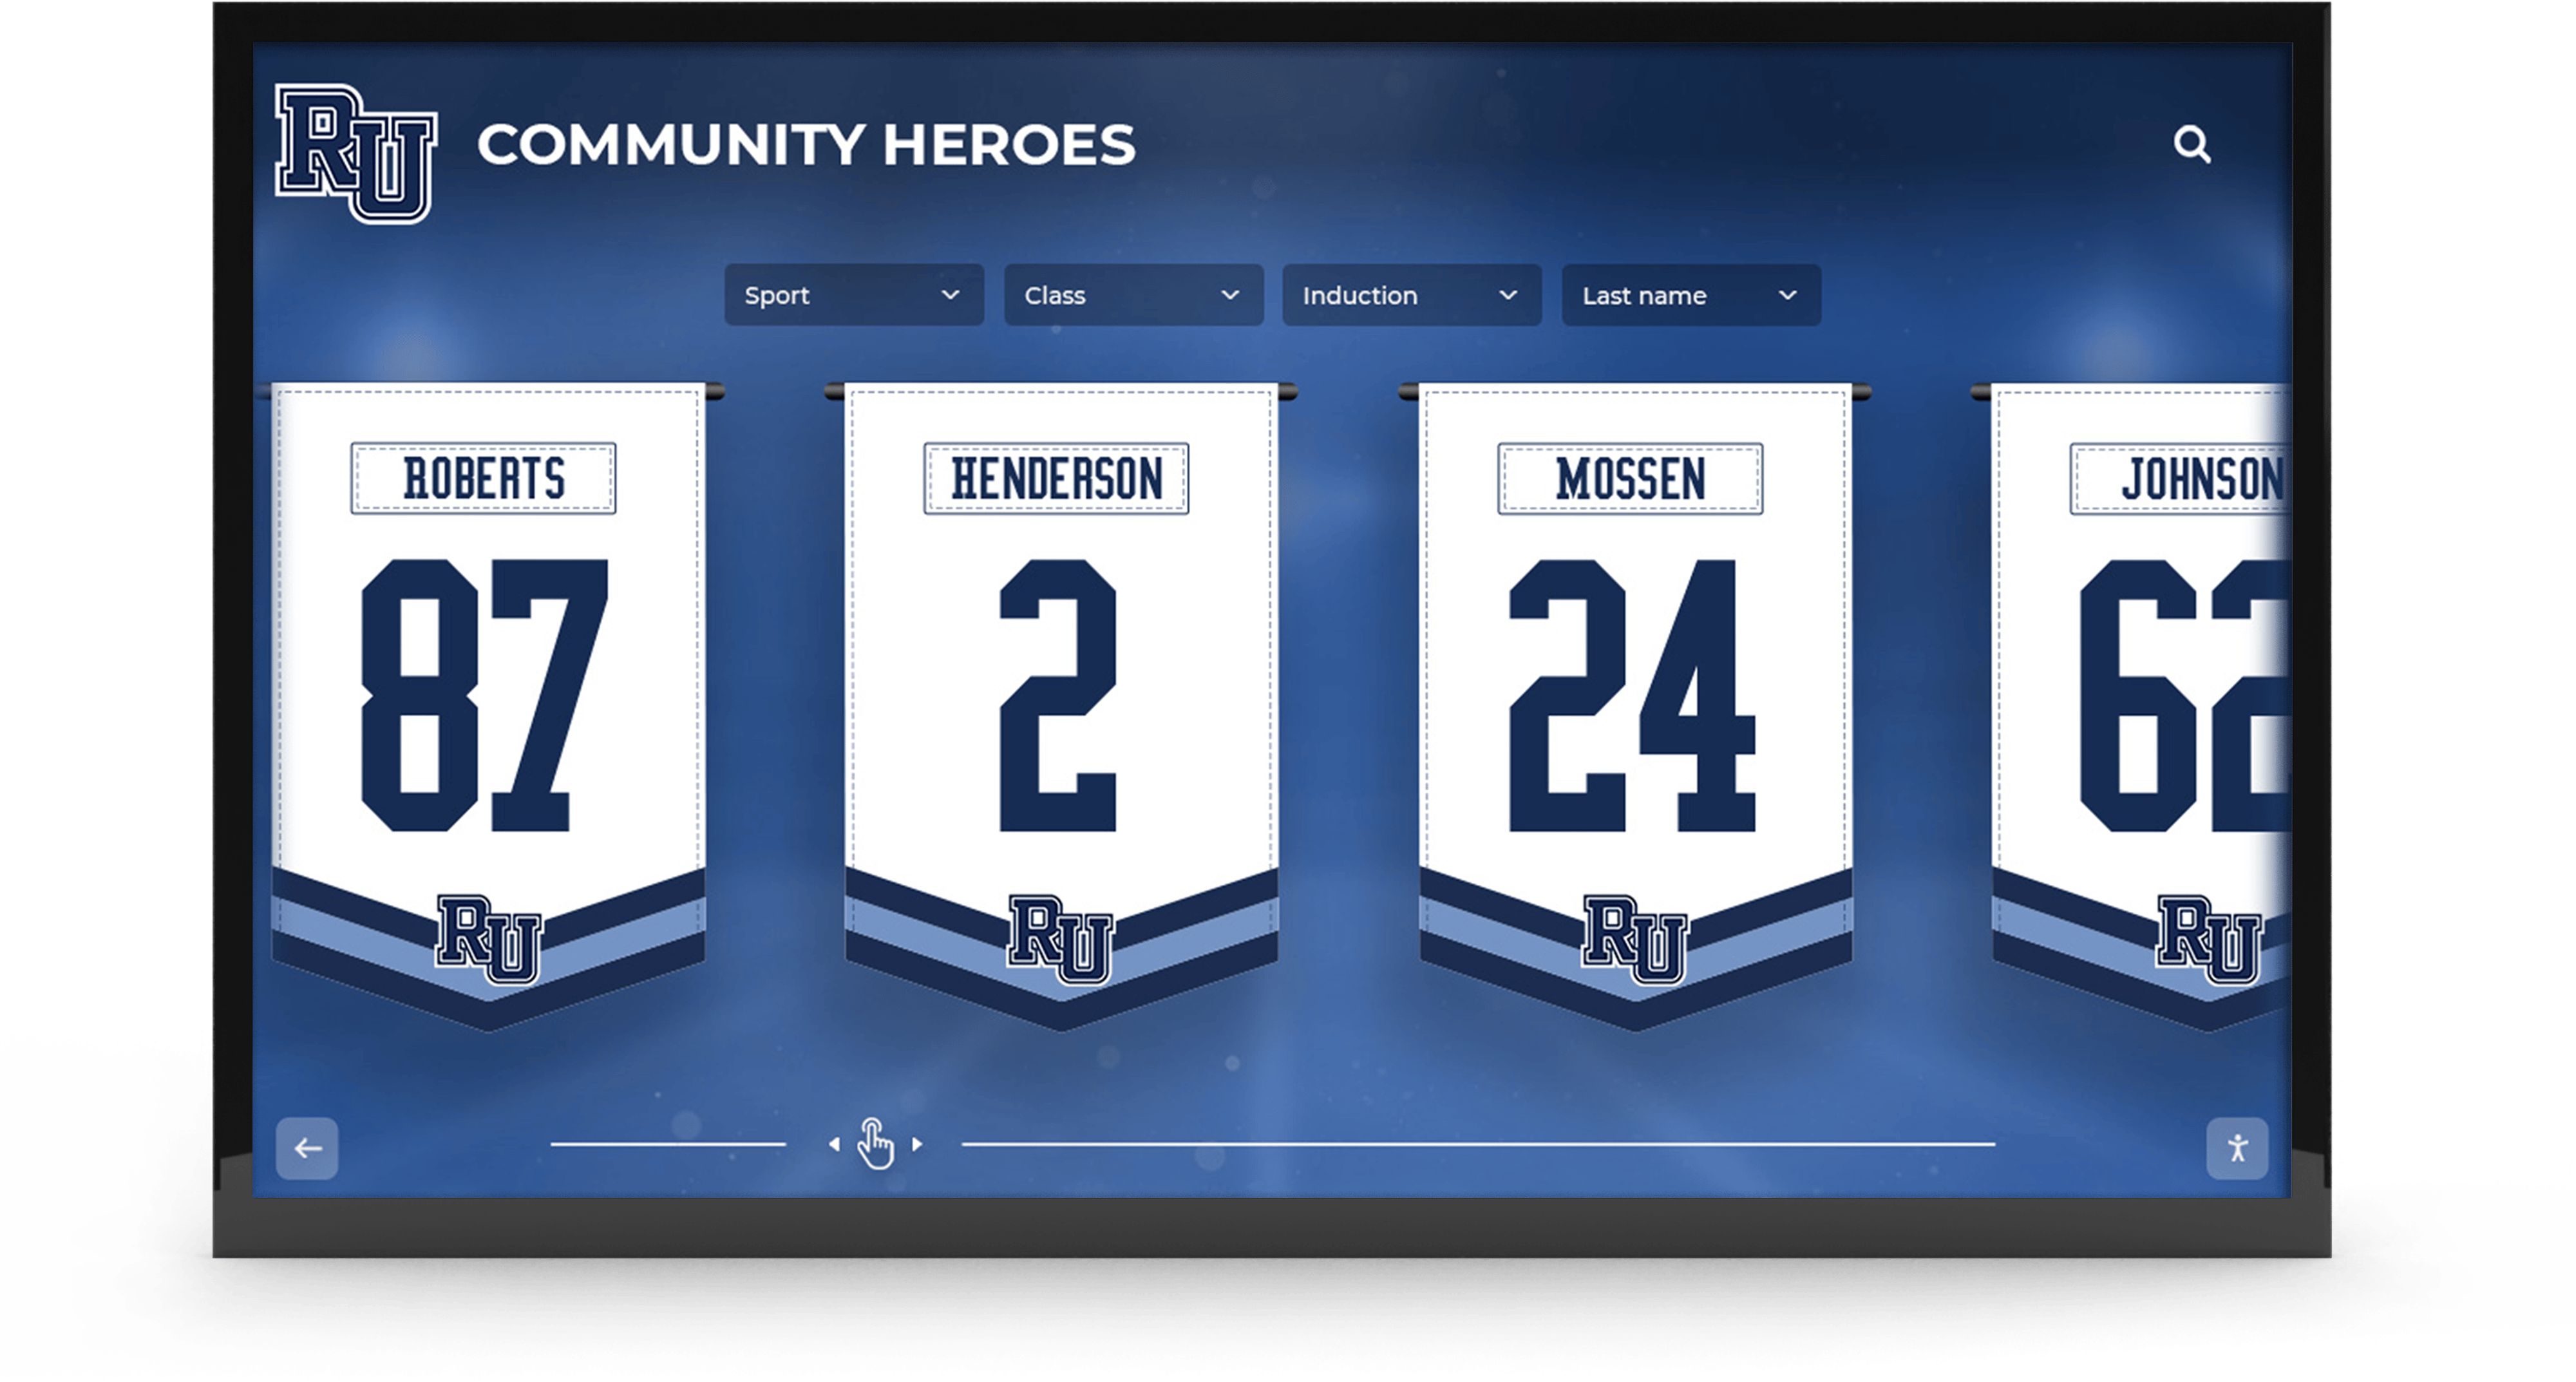
Clear Hierarchy and Readability: Primary information—classroom names and donation totals—should be immediately visible from significant distances. Use large, bold typography, high color contrast between text and backgrounds, consistent formatting that allows quick scanning, and strategic use of school colors maintaining brand identity while ensuring legibility.
Dynamic Visual Elements: Static displays become invisible as students habituate to unchanging stimuli. Incorporate animation showing recent ranking changes, color coding highlighting top performers or biggest gainers, progress bars visualizing how close classrooms are to catching leaders, and countdown timers showing time remaining in drives creating urgency.
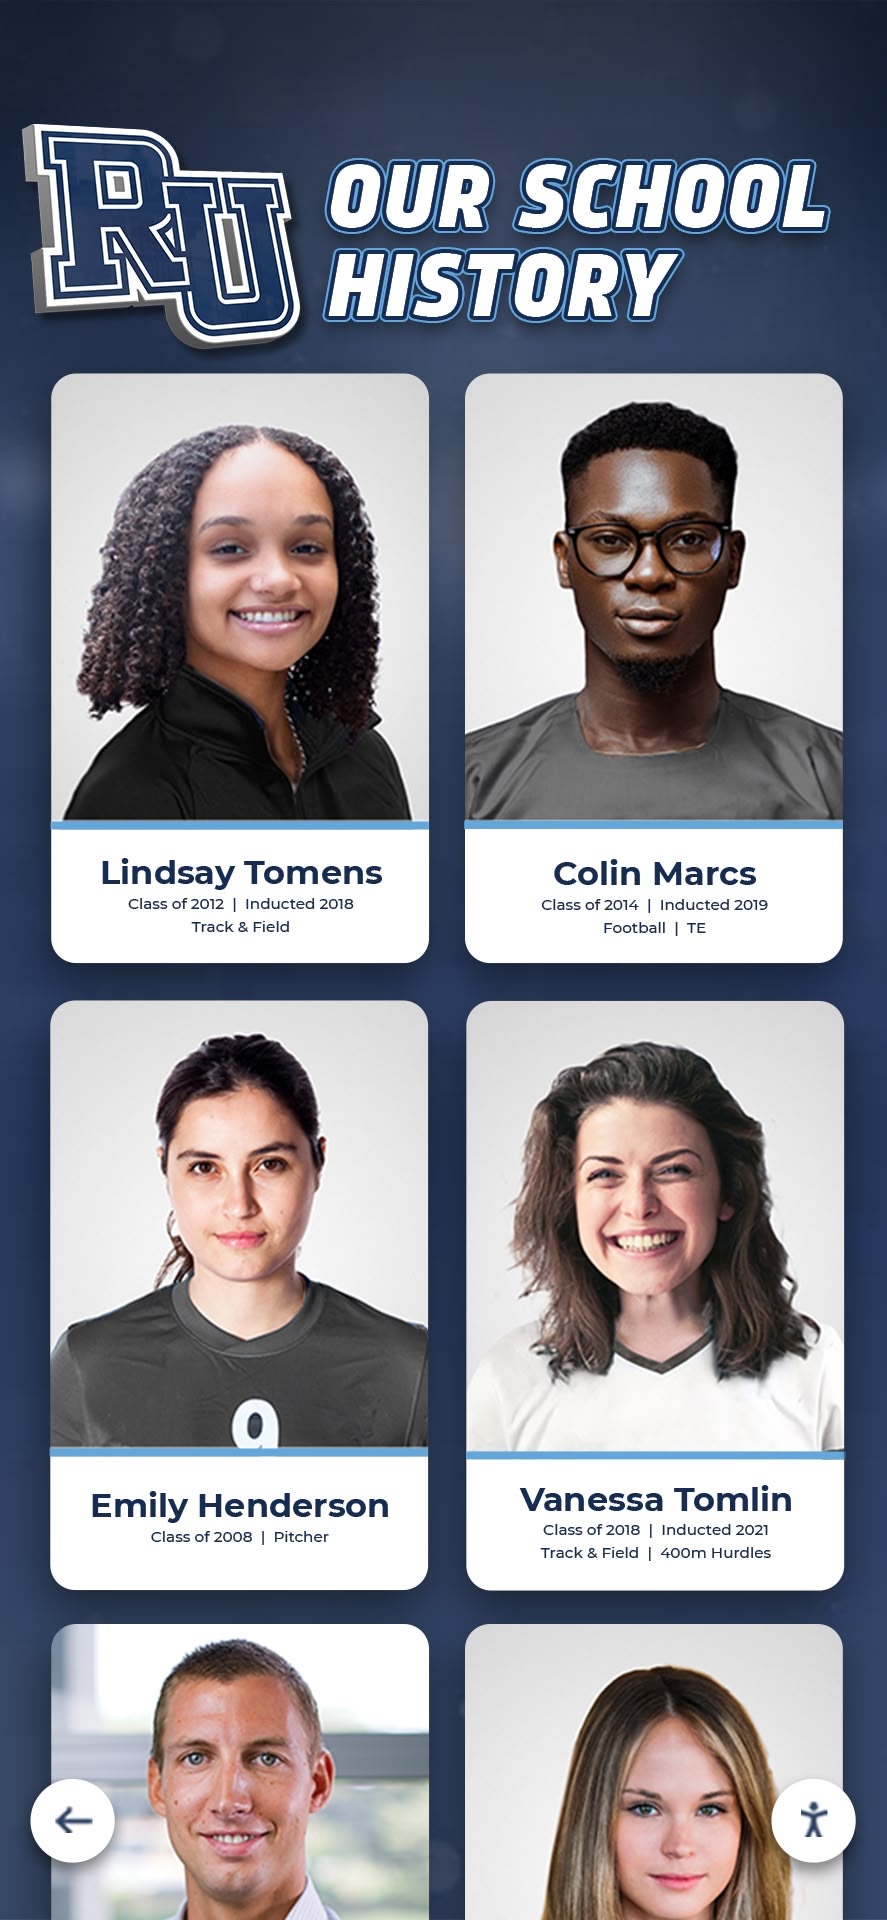
Compelling Graphics and Imagery: Pure numerical tables feel boring and institutional. Include photos of actual donations accumulating, images of students contributing toys, Toys for Tots program branding and logos, festive holiday graphics appropriate to season, and motivational imagery reinforcing charitable mission.
Responsive Design: Content should adapt to various display contexts—widescreen hallway displays, vertical mobile phone screens, classroom projector presentations, or website embeds—maintaining readability and visual appeal regardless of viewing environment.
Accessible Design: Ensure leaderboards accommodate all students through sufficient text size and contrast for visual impairments, color schemes that work for colorblind students, simple language accessible to youngest participants, and intuitive layouts requiring minimal explanation.
Information Architecture and Data Presentation
Beyond visual design, how leaderboards organize and present information affects comprehension and engagement.
Primary Leaderboard View: The main leaderboard display should show:
- Current rankings with clear position numbers (1st, 2nd, 3rd…)
- Classroom or group identifiers
- Current donation totals (items, points, or dollar values)
- Change indicators showing movement since last update (up arrows, down arrows, new badges)
- School-wide totals showing collective progress toward goals
Keep primary views simple enough to comprehend during brief passing period glances—students should grasp current standings in 10-15 seconds without stopping to study detailed information.
Detailed Statistics Layers: For interactive displays or web platforms, provide additional detail layers students can explore:
- Per-student donation averages accounting for classroom size differences
- Historical daily totals showing contribution patterns over time
- Category breakdowns if tracking different toy types separately
- Photo galleries showing accumulated donations
- Classroom messages or motivational statements
- Comparison to previous years’ performance at equivalent timepoints
Contextual Information Integration: Effective leaderboards provide context beyond raw numbers:
- Progress indicators showing percentage toward school-wide goals
- Remaining days in collection period
- Impact narratives explaining how donations help children (“Your 500 toys will bring joy to 500 local children this Christmas!”)
- Information about Toys for Tots mission and program
- Recognition of top individual donors (when families consent to recognition)
Update Indicators: Clear timestamping showing when leaderboards last updated helps students understand data currency. “Updated today at 2:15 PM” or “Last updated 30 minutes ago” provides context, while “Updated daily at 3:00 PM” sets expectations about when checking for new standings makes sense.
Storytelling and Narrative Elements
The most engaging leaderboards tell stories about the competition, creating narrative arcs that build interest throughout drives.
Dramatic Narratives: Present leaderboard information highlighting compelling storylines:
- Close competitions: “Smiths and Johnsons separated by just 3 toys!”
- Dramatic comebacks: “Martinez class climbs from 12th to 3rd place in one day!”
- Consistency recognition: “Rodriguez class leads for 5th consecutive day!”
- Upset possibilities: “Williams class needs just 15 toys to take 1st place!”
Historical Context: Connect current performance to program history:
- “This year’s 8th grade is on pace to break their 2023 record!”
- “School-wide total of 387 toys exceeds last year’s final count!”
- “Thompson class’s 67 toys is the highest single-classroom total in school history!”
Countdown Drama: Build urgency as drives approach conclusion:
- “Final week! Can anyone catch the leaders?”
- “Only 48 hours remain—every donation counts!”
- “Last chance to help your class reach the podium!”
Personal Voices: When possible, include authentic student perspectives:
- Brief quotes from winning classrooms about their strategies
- Messages from teachers thanking families for support
- Reflections from students about why Toys for Tots participation matters to them
- Testimonials from previous years about charitable giving experiences
Research shows that digital leaderboards can track virtually any classroom metric, and when combined with storytelling elements, they motivate students with live progress tracking and friendly competition that maintains engagement throughout extended initiatives.
Implementation Strategies for Maximum Participation
Even perfectly designed leaderboards fail to generate impact without strategic implementation considering how you’ll promote drives, update data, and maintain momentum throughout collection periods.
Launch Strategies That Build Early Excitement
How you introduce Toys for Tots drives with virtual leaderboard tracking sets the tone for entire campaigns and significantly impacts initial participation rates.
Anticipation Building: Generate excitement before drives officially launch through teaser announcements revealing upcoming competition, preview demonstrations of how leaderboards will work, countdown timers to drive start dates, previous year highlight videos showing past success, and sneak peek graphics showing leaderboard design.
Kick-Off Events: Launch drives with special events creating memorable experiences rather than simple announcements. Consider school-wide assemblies explaining Toys for Tots mission and competition structure, video presentations featuring local Marine coordinators, dramatic leaderboard unveiling ceremonies, first-day competition with extra points encouraging immediate participation, and participation incentives like small prizes for classrooms contributing on day one.
Multi-Channel Communication: Ensure all stakeholders understand how virtual leaderboard-driven drives work through student assemblies or classroom presentations, detailed emails to families explaining participation mechanics, flyers sent home with drive details and deadlines, social media posts promoting campaign launch, and website features with competition information and real-time leaderboard embeds.
Clear Instruction: Many Toys for Tots drives underperform because families don’t clearly understand what to donate, where to deliver items, or how tracking works. Provide specific guidance about appropriate toy types and age ranges, donation drop-off locations and procedures, whether monetary contributions are accepted, how often leaderboards update, and what happens at drive conclusion.
Schools implementing effective student engagement strategies emphasize that clear communication about recognition systems significantly increases participation compared to assumed understanding of poorly explained programs.
Data Collection and Update Protocols
Leaderboard effectiveness depends on frequent, accurate updates. Establish sustainable processes ensuring regular data collection without overwhelming staff.
Designated Data Collectors: Assign clear responsibility for counting and reporting donations. Elementary schools might have homeroom teachers count and report daily, middle and high schools might designate student council members or class officers as counters, volunteer coordinators could manage collection point monitoring, or student volunteers from community service programs could take on counting responsibilities.
Counting Procedures: Standardize how donations are counted to ensure consistency. Establish whether toys in multi-packs count as one item or individual items, how book donations factor into totals if tracking separately, whether monetary donations convert to item equivalents, and whether large items (bicycles, gaming systems) count differently than small toys.
Update Frequency: Balance update frequency with staff capacity and student engagement needs. Daily updates provide optimal real-time feel that maximizes competitive dynamics and maintains student interest. If daily updating proves unsustainable, every-other-day updates maintain reasonable currency while reducing burden. Minimum weekly updates risk losing the immediacy that makes virtual leaderboards effective.
Update Timing: Schedule updates at consistent times students anticipate. Many schools update leaderboards at end of school days, allowing students to check standings before leaving and families to view updated totals at home that evening. Morning updates before school starts create anticipation students can discuss throughout the day.
Verification Systems: Implement verification steps ensuring data accuracy before publication. Require teachers to sign off on reported totals, have student counters verify each other’s counts, spot-check physical donations against reported numbers periodically, and photograph donation accumulation providing visual documentation.
Communication Workflows: Streamline how data moves from collectors to leaderboard publishers through digital forms or spreadsheets counters complete, automated notifications alerting publishers when new data awaits, approval workflows for coordinators to review before publishing, and saved templates making repeated updates quick and consistent.
Maintaining Momentum Throughout Drives
Initial enthusiasm naturally wanes as novelty fades and competing priorities reclaim attention. Strategic interventions maintain engagement throughout multi-week collection periods.
Mid-Drive Promotions: Introduce new elements breaking monotony:
- Double-Point Days: Designate specific days where donations count double, creating urgency and boosting participation during typically slow periods
- Category Challenges: Introduce special challenges like “Book Bonanza Wednesday” awarding bonus points for book donations on particular days
- Surprise Bonuses: Randomly award bonus points to classrooms meeting certain criteria, creating excitement and unpredictability
- Staff Challenges: Have teachers or administrators issue personal challenges (“If we collect 100 toys this week, Principal Johnson will wear a superhero costume!”)
- Mystery Benefactor: Create intrigue through anonymous substantial donations credited to “mystery classroom supporter” generating speculation and conversation
Progress Celebrations: Recognize milestones throughout drives, not just at conclusions:
- Celebrate school-wide goals reached (200 toys collected, $1,000 equivalent value)
- Recognize classrooms reaching personal milestones (first classroom to 50 toys)
- Honor daily high contributors even if not overall leaders
- Acknowledge participation growth (most-improved classroom rankings)
- Share impact stories from Toys for Tots about how donations help children
Visual Momentum Indicators: Help students see progress toward goals through thermometer graphics showing progress to school-wide targets, countdown calendars marking days remaining, photo galleries showing growing donation piles, comparison charts showing current year versus previous years at same point, and projection calculations estimating final totals if current pace continues.
Peer Motivation: Facilitate positive peer encouragement through classroom poster campaigns supporting each other, congratulatory messages on displays from leading classes to challengers, friendly rivalry videos or messages between competing classes, school-wide chain challenges where classes challenge specific rivals, and collaborative class strategies discussed in advisory periods.
Research on classroom competition benefits shows that sustained engagement depends on regular recognition, varied challenge types, and visible progress indicators that help students see connection between their efforts and measurable outcomes.
Final Push Strategies
The last few days before drive deadlines create natural urgency, but strategic approaches amplify final participation surges.
Countdown Emphasis: Make remaining time viscerally obvious through prominent countdown timers on all displays, daily announcements emphasizing urgency (“Only 3 days left!”), final-hour countdowns during closing school days, and last-day extended collection hours providing additional contribution opportunities.
Comeback Opportunities: Structure final periods to enable dramatic finishes:
- Publish standings frequently during final days showing rapidly evolving competitions
- Highlight mathematically possible ranking changes (“Thomas class needs just 12 toys to reach 2nd place!”)
- Create final-day super bonus points making dramatic jumps achievable
- Consider final-hour surprise multipliers (“All donations in the last hour count triple!”)
Public Finale Events: Conclude drives with celebratory events providing emotional closure:
- Final count ceremonies where coordinators tally last-minute donations
- Trophy or certificate presentations for winning classrooms
- Overall total reveal with comparison to goals and previous years
- Thank you messages from local Toys for Tots coordinators
- Photo opportunities with accumulated donations
- Social media posts celebrating school community generosity
Winner Recognition: Provide meaningful recognition for leading participants:
- Display top classrooms prominently on leaderboards and around school
- Feature winning classes in newsletters, website, social media
- Award certificates, trophies, or prizes if using tangible incentives
- Arrange special experiences like lunch with principal or extra privileges
- Invite local media coverage for significant donation achievements
- Recognize sustained leaders, biggest final surge, most-improved, and participation percentage winners creating multiple honor categories

Measuring Success and Continuous Improvement
Effective virtual leaderboard programs assess impact through multiple measures, ensuring Toys for Tots drives achieve intended objectives while justifying continued investment in these approaches.
Quantitative Success Indicators
Donation Volume Metrics: Track concrete donation outcomes:
- Total toys collected school-wide
- Average donations per student enrolled
- Donation value based on approximate retail prices
- Comparison to previous years’ totals
- Comparison to projections or stated goals
- Regional or district comparison if available
Participation Rates: Measure engagement breadth:
- Percentage of classrooms contributing at least once
- Percentage of families estimated to have participated
- Number of repeat contributors versus one-time donations
- Distribution of donations across grade levels
- Participation in bonus challenges or special events
Competitive Dynamics: Analyze how leaderboard competition unfolded:
- Number of lead changes throughout drive
- Margin of victory between top placements
- Number of classrooms within competitive range of leaders
- Largest single-day swings in rankings
- Comeback narratives and dramatic developments
- Close finishes creating sustained engagement
Engagement Analytics: For digital systems, monitor usage data:
- Leaderboard page views or display interactions
- Time spent viewing leaderboard content
- Most-accessed information layers
- Peak viewing times correlating with update schedules
- Social media engagement with leaderboard posts
- QR code scans linking to standings
Qualitative Impact Assessment
Beyond numbers, leaderboard-driven Toys for Tots drives influence school culture through less quantifiable but equally important mechanisms.
Student Attitudes and Experience: Survey or interview students about:
- Whether leaderboards made drives more interesting and engaging
- If competition felt fun versus stressful
- Whether students checked standings regularly
- If visibility motivated them to contribute or encourage family participation
- What leaderboard features they found most compelling
- Suggestions for improving future competitions
Family Feedback: Gather family perspectives about:
- Whether they found leaderboards informative and engaging
- If real-time tracking helped them stay aware of drive progress
- Whether competition element encouraged their participation
- Appropriate balance between competition and charitable spirit
- Communication effectiveness about drive and leaderboard mechanics
- Interest in similar approaches for future school initiatives
Teacher and Staff Observations: Collect staff feedback about:
- Student conversations and excitement about leaderboard standings
- Ease of data collection and update processes
- Whether workload felt sustainable
- Observed impact on classroom dynamics and spirit
- Notable student leadership or initiative inspired by competition
- Recommendations for process improvements
Community and Media Response: Assess broader visibility and perception:
- Local media coverage received
- Social media reach and engagement
- Community recognition of school’s charitable effort
- Toys for Tots coordinator feedback about donation quality and coordination
- Parent organization or school board response to initiative
- Community members’ awareness of school drive success
Long-Term Program Evolution
Virtual leaderboard systems should continuously improve based on experience and stakeholder feedback.
Annual Review Process: After each Toys for Tots drive, conduct comprehensive assessment:
- Compile quantitative data about donations, participation, and engagement
- Analyze what worked well and generated positive responses
- Identify pain points, challenges, or negative feedback
- Document lessons learned and specific improvement opportunities
- Compare outcomes to goals and previous years
- Celebrate successes appropriately with coordinators and volunteers
Iterative Refinement: Make evidence-based improvements for subsequent years:
- Adjust update frequency based on staff capacity and engagement impact
- Refine visual design addressing readability or appeal feedback
- Enhance features students most engaged with
- Streamline data collection reducing coordinator burden
- Improve communication addressing confusion or questions
- Expand successful elements to other school initiatives
Technology Evolution: Reassess whether current platforms optimally serve needs:
- Evaluate whether displays provide adequate visibility and engagement
- Consider upgrading from basic to interactive systems if value demonstrated
- Assess whether web-based platforms received meaningful usage
- Review whether content management systems met ease-of-use needs
- Explore enhanced features as platforms evolve
- Consider cost-benefit of technology investments based on observed impact
Extension to Other Initiatives: Apply successful virtual leaderboard approaches beyond Toys for Tots:
- Food drive competitions throughout school year
- Read-a-thon tracking for literacy programs
- School supply collection drives
- Environmental initiatives like recycling competitions
- Attendance challenges promoting daily participation
- Academic competitions tracking class achievement metrics
Schools implementing comprehensive digital recognition approaches find that virtual leaderboard success with charitable drives often expands to broader applications creating consistent engagement cultures where students regularly track progress toward diverse individual and collective goals.
Special Considerations and Best Practices
Successful virtual leaderboard implementation requires attention to various practical, ethical, and logistical considerations ensuring programs remain positive experiences that serve charitable missions effectively.
Maintaining Charitable Spirit Amid Competition
The most important consideration when implementing competitive elements in charity drives involves ensuring competition serves rather than undermines charitable purposes.
Emphasize Impact Over Winning: Consistently message that drive success means helping children in need, not which classroom ranks highest. Leaderboards should be framed as tools for tracking collective progress toward impact goals, with competition serving as engagement mechanism rather than primary purpose. Celebrate school-wide totals and charitable impact as much or more than individual classroom rankings.
Recognize All Contributors: Design recognition systems honoring diverse participation levels beyond just winners. Award participation certificates to all contributing classrooms, recognize “most improved” classrooms showing greatest growth, acknowledge special achievements like “most consistent” classrooms contributing every day, and celebrate individual generous donations regardless of classroom totals.
Teach Charitable Giving: Use drives as educational opportunities discussing why charitable giving matters, who Toys for Tots serves and how donations help, broader issues of economic inequality and community responsibility, and meaningful giving as lifelong practice versus one-time competition.
Prevent Negative Competition: Monitor for unhealthy competitive dynamics like shaming or pressure directed at non-contributing families, inter-classroom taunting or mean-spirited rivalry, stress or anxiety about rankings among students, and exclusion of students whose families cannot afford donations. Address any negative behaviors immediately, emphasizing positive encouragement and inclusive participation.
Value Over Volume: Consider tracking criteria beyond simple quantity to recognize thoughtful giving. Award bonus points for particularly needed items identified by Toys for Tots coordinators, recognize book donations supporting literacy missions, honor new, quality items versus cheap quantity maximization, and create separate recognition for monetary donations from students who choose financial contributions.
Privacy and Sensitivity Considerations
Virtual leaderboards displaying public information require careful attention to privacy, family circumstances, and student sensitivities.
Family Privacy: Never publicly identify which students or families contributed specific donations. Leaderboard tracking at classroom level aggregates contributions protecting individual privacy while still enabling competition. Avoid displays listing individual donor names unless families explicitly consent to public recognition.
Socioeconomic Sensitivity: Recognize that families face vastly different financial circumstances. Participation should never feel mandatory or create stigma for students whose families cannot afford donations. Offer alternative participation pathways like helping collect donations from others, creating promotional posters, counting or organizing toys, or contributing time versus items.
Inclusive Participation: Design drives so every student can participate meaningfully regardless of family resources. Consider school-provided toys that students without donations can contribute, allow earned classroom points for non-donation support activities, avoid situations where students feel embarrassed about non-participation, and emphasize that helping organize drives matters as much as donating items.
Transfer and New Students: Establish policies for students arriving after drives begin or leaving before conclusion. Consider allowing late joiners to contribute to new classrooms retroactively, prorating participation expectations for partial-period enrollment, and ensuring transfer students don’t feel excluded from classroom competitions already underway.
Disability Accommodations: Ensure leaderboard displays and participation mechanisms accommodate all students. Digital leaderboards should meet accessibility standards for visual impairments, participation options should accommodate diverse abilities, physical donation drop-off locations should be accessible, and counting or organizational tasks should include roles for students with various capabilities.
Logistical Planning and Coordination
Practical logistics significantly impact whether ambitious virtual leaderboard drives function smoothly or become chaotic frustrations.
Storage and Organization: Plan where substantial donated toys will be stored during collection periods. Large successful drives might accumulate hundreds or thousands of toys requiring significant space. Consider whether each classroom stores its own donations versus central collection, how you’ll secure donations from loss or damage, whether storage allows photographing accumulations for leaderboard content, and coordination with Toys for Tots about pickup scheduling and volume handling.
Safety and Supervision: Especially for younger students, plan supervision around donation activities. Consider whether students will carry donations directly to classrooms or central locations, if you need adult supervision at busy collection points, how you’ll prevent loss or theft of donations, and whether valuable or large donations need special handling procedures.
Verification and Accuracy: Implement systems ensuring reported numbers match physical donations. Require adult verification of student counts, photograph donation collections for documentation, conduct periodic spot-checks of reported totals, and establish dispute resolution procedures if questions arise about accuracy.
Communication with Toys for Tots: Coordinate closely with local Marine coordinators about timing of pickup, preferred donation organization, any items needing special handling, how they’d like large quantities managed, and whether they can provide impact updates to share with school community after distribution.
Weather and Schedule Contingencies: For drives spanning multiple weeks, plan for schedule disruptions from weather closures, holiday breaks, or other interruptions. Consider how extended weekends affect momentum, whether you’ll update leaderboards during breaks, and how to communicate any deadline changes.

Technology Integration and Platform Selection
Choosing appropriate technology platforms significantly impacts implementation ease, ongoing maintenance requirements, and student engagement quality.
Platform Requirements and Selection Criteria
When evaluating virtual leaderboard platforms, consider these essential capabilities and selection factors:
Core Functional Requirements:
- Easy data entry from non-technical staff
- Automatic ranking calculation and sorting
- Real-time or near-real-time update capability
- Visual chart generation (bar charts, line graphs, etc.)
- Mobile-responsive design for multi-device access
- Historical data tracking throughout drive periods
- Customizable branding with school colors and logos
- Export capabilities for final reports and documentation
User Experience Considerations:
- Intuitive navigation requiring minimal explanation
- Fast page loading even with many concurrent users
- Clear visual hierarchy emphasizing key information
- Engaging graphics that capture student attention
- Accessibility compliance for diverse student needs
- Simple QR code generation for mobile access
- Shareable content for social media promotion
Administrative and Management Features:
- Multi-user access with appropriate permissions
- Scheduled updates or immediate publishing options
- Draft mode for preparing content before release
- Analytics tracking engagement and interaction
- Integration with existing school communication platforms
- Technical support and documentation quality
- Reasonable cost appropriate to school budgets
Scalability and Flexibility:
- Ability to handle participation from entire school
- Support for multiple simultaneous competitions if desired
- Capacity to extend to other initiatives beyond Toys for Tots
- Customizable data fields beyond basic rankings
- Photo and multimedia content integration
- Archive capabilities for historical reference
Free and Low-Cost Platform Options
Schools with constrained budgets can implement effective virtual leaderboards using free or low-cost tools:
Google Sheets with Public Sharing: Create shared spreadsheets that automatically calculate rankings using formulas. Format attractively with conditional formatting, charts, and school branding. Publish to web allowing public viewing while restricting editing to authorized staff. While less polished than dedicated platforms, Google Sheets provide free, functional leaderboard capabilities requiring only creativity in design and organization.
Free Leaderboard Tools: Platforms like Leaderboarded.com, KeepTheScore, and MakeTheBoard offer free or freemium versions supporting basic leaderboard functionality. These tools provide more engaging interfaces than spreadsheets while remaining budget-friendly for schools testing approaches before larger investments.
School Website Integration: Many school websites support custom pages or embedded content. Create dedicated Toys for Tots drive pages with manually updated leaderboards using basic HTML or website content management systems. While requiring more frequent manual updates, this approach leverages existing infrastructure without additional costs.
Presentation Software Displays: Create attractive leaderboard presentations using Google Slides, PowerPoint, or Canva that refresh periodically. Display on existing classroom or hallway screens, updating files as new data becomes available. This low-tech approach works surprisingly well for schools with existing digital signage infrastructure and staff comfortable with presentation software.
Professional Digital Recognition Platforms
Schools seeking premium experiences, sophisticated features, and long-term versatility beyond single-initiative use should consider professional platforms designed specifically for educational recognition and engagement.
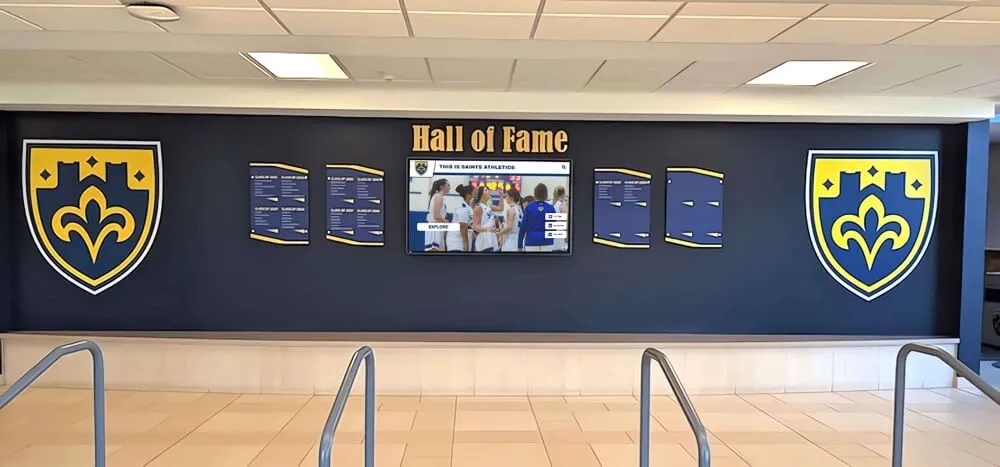
Comprehensive School Recognition Systems: Platforms like Rocket Alumni Solutions provide integrated systems managing diverse recognition needs including charitable drive leaderboards alongside academic honors, athletic achievements, student of the month programs, and historical archives. These comprehensive systems justify investment through multi-purpose application across school year versus single-use charitable drive tracking.
Professional platforms typically offer:
- Purpose-built content management requiring no technical expertise
- Interactive touchscreen displays engaging students beyond passive viewing
- Automated data workflows reducing administrative burden
- Professional design quality reflecting positively on schools
- Ongoing platform updates and feature enhancements
- Responsive customer support addressing questions promptly
- Proven approaches based on experience with thousands of schools
- Long-term value through expandability to additional use cases
Investment Considerations: Professional interactive touchscreen systems typically range from $6,500 to $15,000 for hardware, installation, and initial setup, with annual software subscriptions of $1,000 to $3,000 depending on features. While representing substantial investment, schools often find total cost of ownership favorable when considering labor savings, unlimited capacity, enhanced engagement, and versatility across multiple applications over multi-year periods.
For schools implementing comprehensive approaches to student recognition and community engagement, professional platforms provide foundation for recognition cultures extending well beyond individual charity drives to encompass all ways schools celebrate achievement, contribution, and positive character.
Conclusion: Transforming Charity Through Engaging Competition
Toys for Tots classroom virtual leaderboards represent far more than high-tech donation tracking. When implemented thoughtfully, these systems transform passive charity drives into dynamic experiences that capture student imagination, create sustained engagement through friendly competition, teach valuable lessons about community service and collective impact, dramatically increase donation totals serving more children in need, and build school cultures where charitable giving becomes exciting tradition students anticipate and embrace.
The most successful implementations share common characteristics regardless of specific technology platforms or implementation details:
- Clear communication ensuring all stakeholders understand competition mechanics and charitable purpose
- Frequent updates maintaining leaderboard currency and sustaining student interest
- Balanced emphasis on both competition excitement and underlying charitable mission
- Strategic momentum maintenance through mid-drive promotions and engagement strategies
- Inclusive design ensuring all students can participate meaningfully regardless of family circumstances
- Meaningful recognition celebrating diverse contributions beyond just volume winners
- Integration with broader school culture rather than isolated annual events
- Continuous improvement based on outcome assessment and stakeholder feedback
The investment schools make in virtual leaderboard systems yields returns in charitable impact, student engagement, community service education, and school spirit. Leaderboards communicate that schools value charitable giving enough to track progress systematically, celebrate contribution publicly, and create experiences making generosity enjoyable rather than obligatory. During formative school years when students develop attitudes about civic responsibility and helping others, positive charitable drive experiences help shape lifelong patterns of community engagement and service.
Whether implementing comprehensive interactive touchscreen systems, leveraging existing digital displays for seasonal leaderboard content, or starting with simple web-based platforms testing virtual leaderboard concepts, the principles remain consistent: make progress visible, create engaging competition, maintain frequent updates, balance competitive and charitable elements, and celebrate contribution at all levels. Virtual leaderboards that follow these principles transform Toys for Tots drives from forgettable routines into memorable experiences students genuinely care about, creating both immediate charitable impact and long-term character development.
Ready to transform your school’s Toys for Tots drive into an engaging experience students actually embrace? Modern solutions like Rocket Alumni Solutions provide comprehensive platforms specifically designed for educational recognition and engagement—combining intuitive content management, engaging display capabilities, proven leaderboard approaches, and ongoing support helping schools create charitable drive experiences that maximize both student engagement and community impact.
Your school community possesses tremendous charitable capacity—effective virtual leaderboard systems ensure that capacity transforms into meaningful action helping children in need while teaching students valuable lessons about service, community, and the joy of giving that will serve them throughout their lives.