Key Takeaways
Compare interactive touchscreen kiosk solutions for events, trade shows, and functions. Learn which platforms deliver reliable performance, flexible content management, and professional presentation capabilities.
Equipment manufacturers increasingly recognize that technical specifications alone no longer differentiate their products. Trade show attendees and event visitors expect interactive experiences that let them explore features at their own pace, compare models side by side, and access detailed information on demand. Static brochures and looping video presentations fail to engage modern audiences who expect the same touch-based interaction they use daily on smartphones and tablets.
The choice between kiosk platforms significantly impacts both visitor engagement metrics and operational efficiency. Organizations that select systems designed for slideshow presentations rather than interactive navigation consistently report higher support requirements, limited content flexibility, and visitor frustration with non-responsive interfaces. Understanding the architectural differences between platform types helps evaluation committees identify which vendors can genuinely support interactive product exploration versus those offering repurposed presentation software.
The Interactive Display Requirement Gap
Equipment manufacturers hosting booth exhibits and facility tours share a common challenge: translating complex technical specifications into accessible, engaging presentations that visitors can explore independently. Traditional presentation methods—printed spec sheets, mounted posters, sales representative explanations—create bottlenecks during high-traffic periods and fail to accommodate different learning styles or detail preferences.
Why Standard Digital Signage Falls Short
Digital signage systems designed for advertising rotation operate on fundamentally different principles than interactive exploration platforms. These architectural differences create specific limitations for event applications:
Content Structure Constraints: Slideshow-based systems organize content as timed sequences. Visitors cannot navigate directly to specific features, compare technical specifications side by side, or explore related products without waiting for content rotation. Equipment manufacturers with diverse product lines find this linear structure particularly limiting when visitors want to compare model specifications or explore upgrade paths.
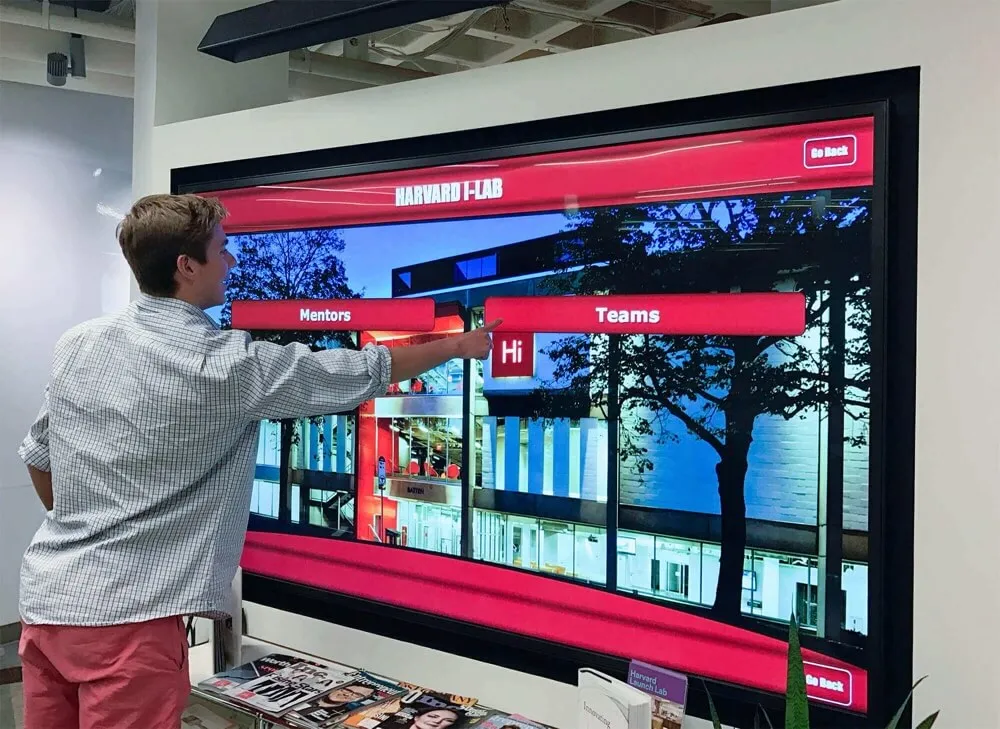
Touch Response Architecture: Many digital signage platforms added touch capability as an afterthought rather than designing around interactive navigation from the ground up. This results in visible lag between touch input and screen response, imprecise hit detection for smaller interface elements, and limited gesture support. Event environments where visitors expect smartphone-level responsiveness expose these architectural weaknesses immediately.
Update Complexity: Systems requiring content rebuilds for minor specification changes or pricing updates create significant pre-event preparation overhead. Equipment manufacturers with products spanning multiple categories need platforms that separate content from presentation logic, allowing specification updates without redesigning entire interface screens.
Hardware Dependencies: Platforms tightly coupled to specific display hardware create problems when organizations need to deploy across venues with varying equipment or when upgrading kiosk hardware between event seasons. True platform independence means identical content and functionality regardless of whether deployment uses 32-inch touchscreens, 55-inch displays, or vertical orientation kiosks.

Evaluation Framework: Five Critical Criteria
Organizations selecting touchscreen kiosk platforms for events should evaluate vendors across five weighted criteria that predict both visitor experience quality and operational sustainability.
1. Database-Driven Architecture vs. Slideshow Systems (Weight: 30%)
The single most important differentiator separates platforms using database-driven content management from those built on slideshow presentation logic.
Database-Driven Platforms store product information, specifications, images, and videos as discrete records that interface software queries dynamically. This architecture delivers several advantages:
- Direct Navigation: Visitors jump immediately to specific products or features through search, category browsing, or cross-reference links
- Comparison Capabilities: Software can present multiple product records side by side without requiring pre-built comparison slides
- Content Reuse: Single product records appear consistently across different navigation paths, ensuring specification accuracy
- Update Efficiency: Changing a specification updates all interface locations that display that information automatically
Slideshow Presentation Systems organize content as sequential screens with limited branching. Equipment manufacturers using these platforms report:
- Requiring complete interface rebuilds when adding new products or updating specifications
- Creating separate slide sequences for different product categories, duplicating shared content
- Inability to offer flexible navigation that accommodates different visitor priorities
- Difficulty maintaining consistency when the same product appears in multiple navigation sequences
If your organization hosts recurring events with product lines that change between shows, or if visitors typically want to explore specific feature categories rather than viewing linear presentations, database-driven architecture becomes mandatory rather than optional.
2. Remote Content Management Capabilities (Weight: 25%)
Event preparation timelines compress as show dates approach. Equipment manufacturers consistently identify last-minute specification updates, pricing changes, and product availability modifications as significant sources of pre-event stress. Remote content management capability—the ability to update kiosk content from any location without accessing physical hardware—separates modern cloud-based platforms from legacy systems requiring on-site updates.
Cloud-Based Content Management allows authorized staff to:
- Update product specifications, pricing, and availability from office locations days before transport
- Make real-time adjustments during multi-day events without physical kiosk access
- Deploy identical content across multiple kiosks simultaneously, ensuring consistency
- Maintain change logs showing who modified what content and when
- Roll back problematic updates immediately if issues appear during events
Local Update Requirements force organizations to:
- Schedule dedicated time to physically access each kiosk before events for content updates
- Coordinate USB drive or direct connection procedures that interrupt setup workflows
- Manually verify content consistency across multiple kiosks
- Accept that last-minute changes discovered during setup cannot be easily corrected
Organizations operating multiple kiosks simultaneously or hosting events across different facilities find cloud-based management increasingly essential rather than merely convenient.
3. Offline Operation Reliability (Weight: 20%)
Event venues rarely provide reliable network connectivity. Trade show floors, temporary facility setups, and outdoor function spaces frequently lack stable internet access or present network security restrictions that block cloud-connected devices. Kiosks that require constant connectivity to function become unusable precisely when needed most.
True Offline Capability means kiosks:
- Download complete content packages during setup while connectivity is available
- Operate with full functionality—including video playback, image galleries, and navigation—without network access
- Queue analytics and interaction logs locally for upload when connectivity returns
- Continue functioning through intermittent connectivity drops without visitor-visible disruptions
Connectivity-Dependent Systems create problems when:
- Content loads slowly or fails to display if network speed drops below thresholds
- Video streaming stutters or buffers during playback
- Interface responsiveness degrades during connectivity interruptions
- Kiosks become completely non-functional if network access is lost
Equipment manufacturers should verify offline capability by disconnecting network access and confirming full functionality persists, including all media playback and navigation features. Marketing claims about “offline support” sometimes mean only basic navigation continues while images and videos fail to load.
4. Analytics and Engagement Tracking (Weight: 15%)
Organizations investing in interactive kiosks need data about what content visitors actually explore, how long they engage with different sections, and which products generate the most interest. This information informs product positioning decisions, marketing emphasis, and future content development priorities.
Comprehensive Analytics Platforms capture:
- Individual visitor session duration and navigation paths
- Most-viewed products and most-accessed specification categories
- Search terms visitors enter when looking for specific features
- Points where visitors exit without completing desired actions
- Comparative engagement metrics across different events or venues
Basic or Missing Analytics force organizations to:
- Rely on subjective staff impressions about visitor interest
- Make content decisions without data about what actually engages audiences
- Miss opportunities to identify popular products that deserve more prominent positioning
- Lack evidence when evaluating whether kiosk investments deliver measurable engagement improvements
Organizations should request sample analytics reports during vendor evaluation to verify that tracking captures actionable insights rather than merely recording raw pageview counts.
5. Multi-Location Content Consistency (Weight: 10%)
Equipment manufacturers often operate multiple kiosks simultaneously—at their booth and at distributor locations, or across different trade shows running concurrently. Ensuring identical content appears across all locations without manual synchronization prevents situations where visitors receive conflicting information about specifications or pricing.
Centralized Content Distribution allows:
- Publishing updates from a single source that propagate to all connected kiosks automatically
- Scheduling content changes to take effect across all locations simultaneously
- Verifying which kiosks run current content versions versus outdated information
- Managing regional variations (pricing differences, model availability) while maintaining core content consistency
Manual Synchronization Requirements create risks where:
- Different kiosks show conflicting specifications for the same product
- Pricing information becomes inconsistent across venues
- Staff must track which kiosks received which updates and manually verify consistency
- Emergency corrections (pricing errors, discontinued models) cannot be deployed quickly across all locations
Organizations operating more than two kiosks simultaneously should treat centralized distribution as a critical requirement rather than a convenience feature.
Platform Comparison Matrix
The following matrix evaluates platform types across the five critical criteria, with scoring weighted according to the percentages established above:
| Criteria (Weight) | Database-Driven Recognition Platforms | Adapted Digital Signage Systems | Custom Development |
|---|---|---|---|
| Database Architecture (30%) | ✓ Built on relational database; unlimited products/categories; flexible navigation | ✗ Slideshow-based; limited branching; requires rebuilds for navigation changes | ✓ Depends on development scope; potential for full flexibility |
| Remote Management (25%) | ✓ Cloud-based CMS; instant updates; multi-device deployment | ◐ Varies; some require physical access; others support limited remote updates | ◐ Depends on architecture; requires ongoing IT infrastructure |
| Offline Operation (20%) | ✓ Full offline capability; downloads content packages; queues analytics | ✗ Often requires connectivity for content delivery and media playback | ✓ Achievable but must be specified and tested |
| Analytics Tracking (15%) | ✓ Detailed interaction tracking; navigation paths; engagement duration | ◐ Basic pageview counting; limited behavioral insights | ✓ Achievable but requires dedicated development |
| Multi-Location Consistency (10%) | ✓ Centralized publishing; version control; simultaneous updates | ✗ Manual synchronization; inconsistency risks | ◐ Achievable but requires backend infrastructure |
| Weighted Score | 90/100 | 42/100 | 70/100 |
Scoring Explanation
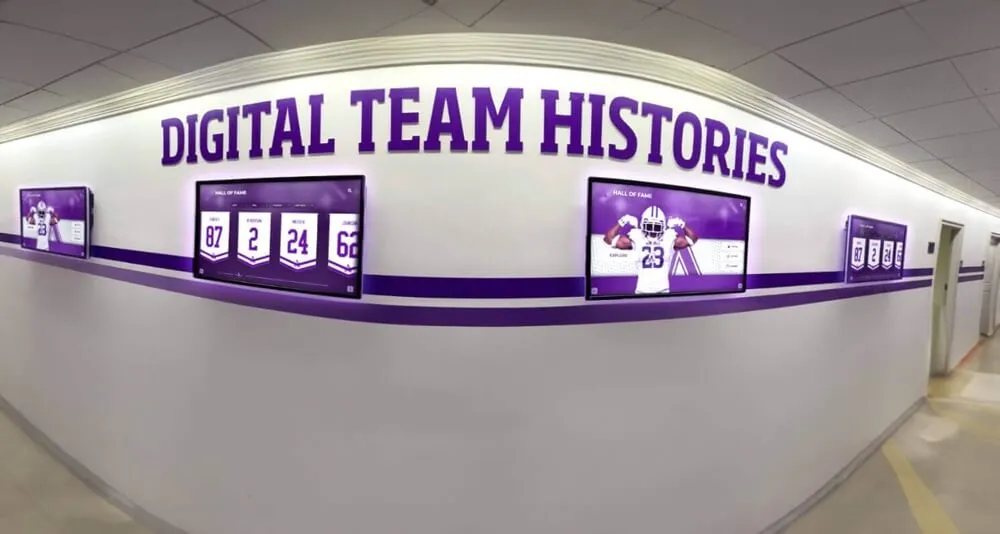
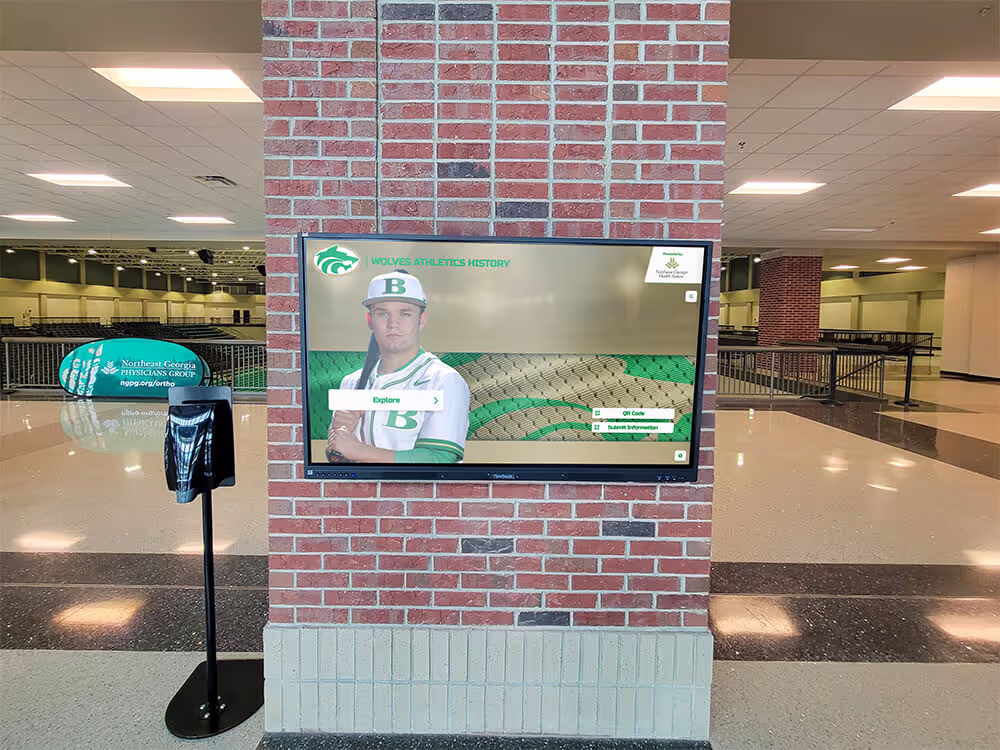
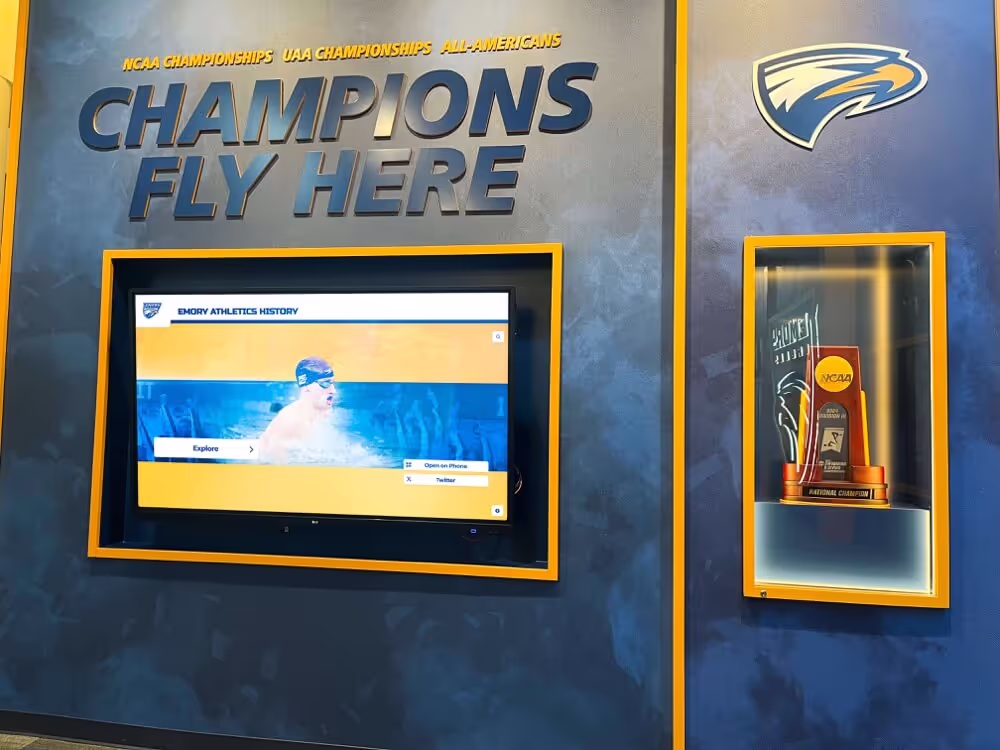
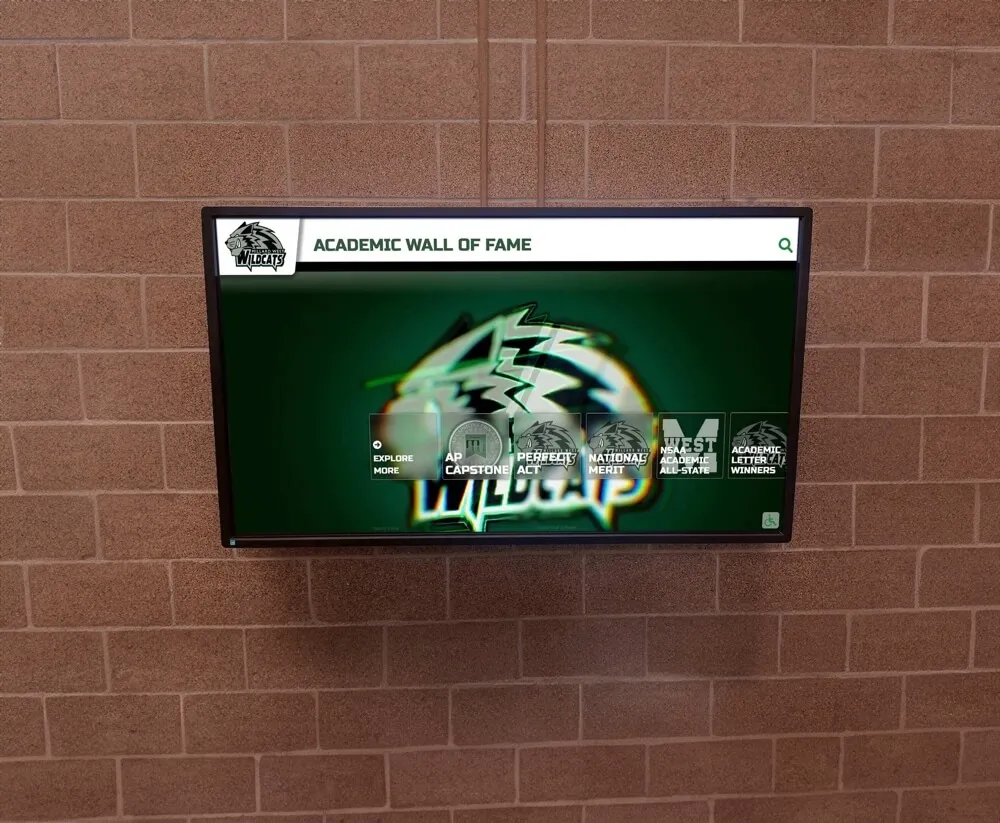
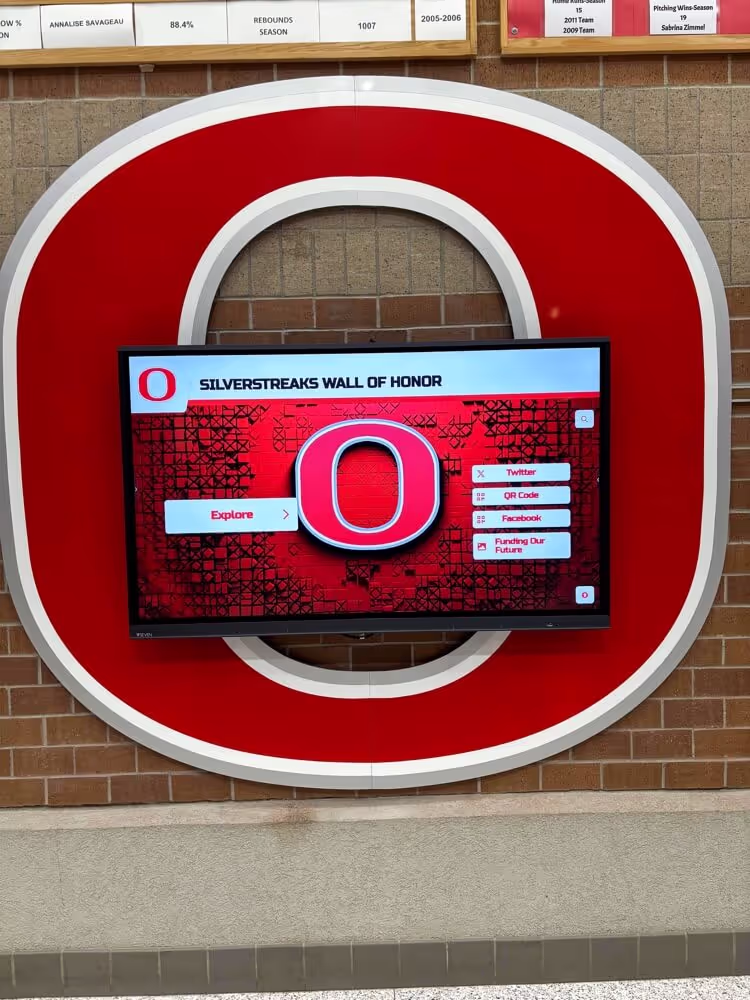
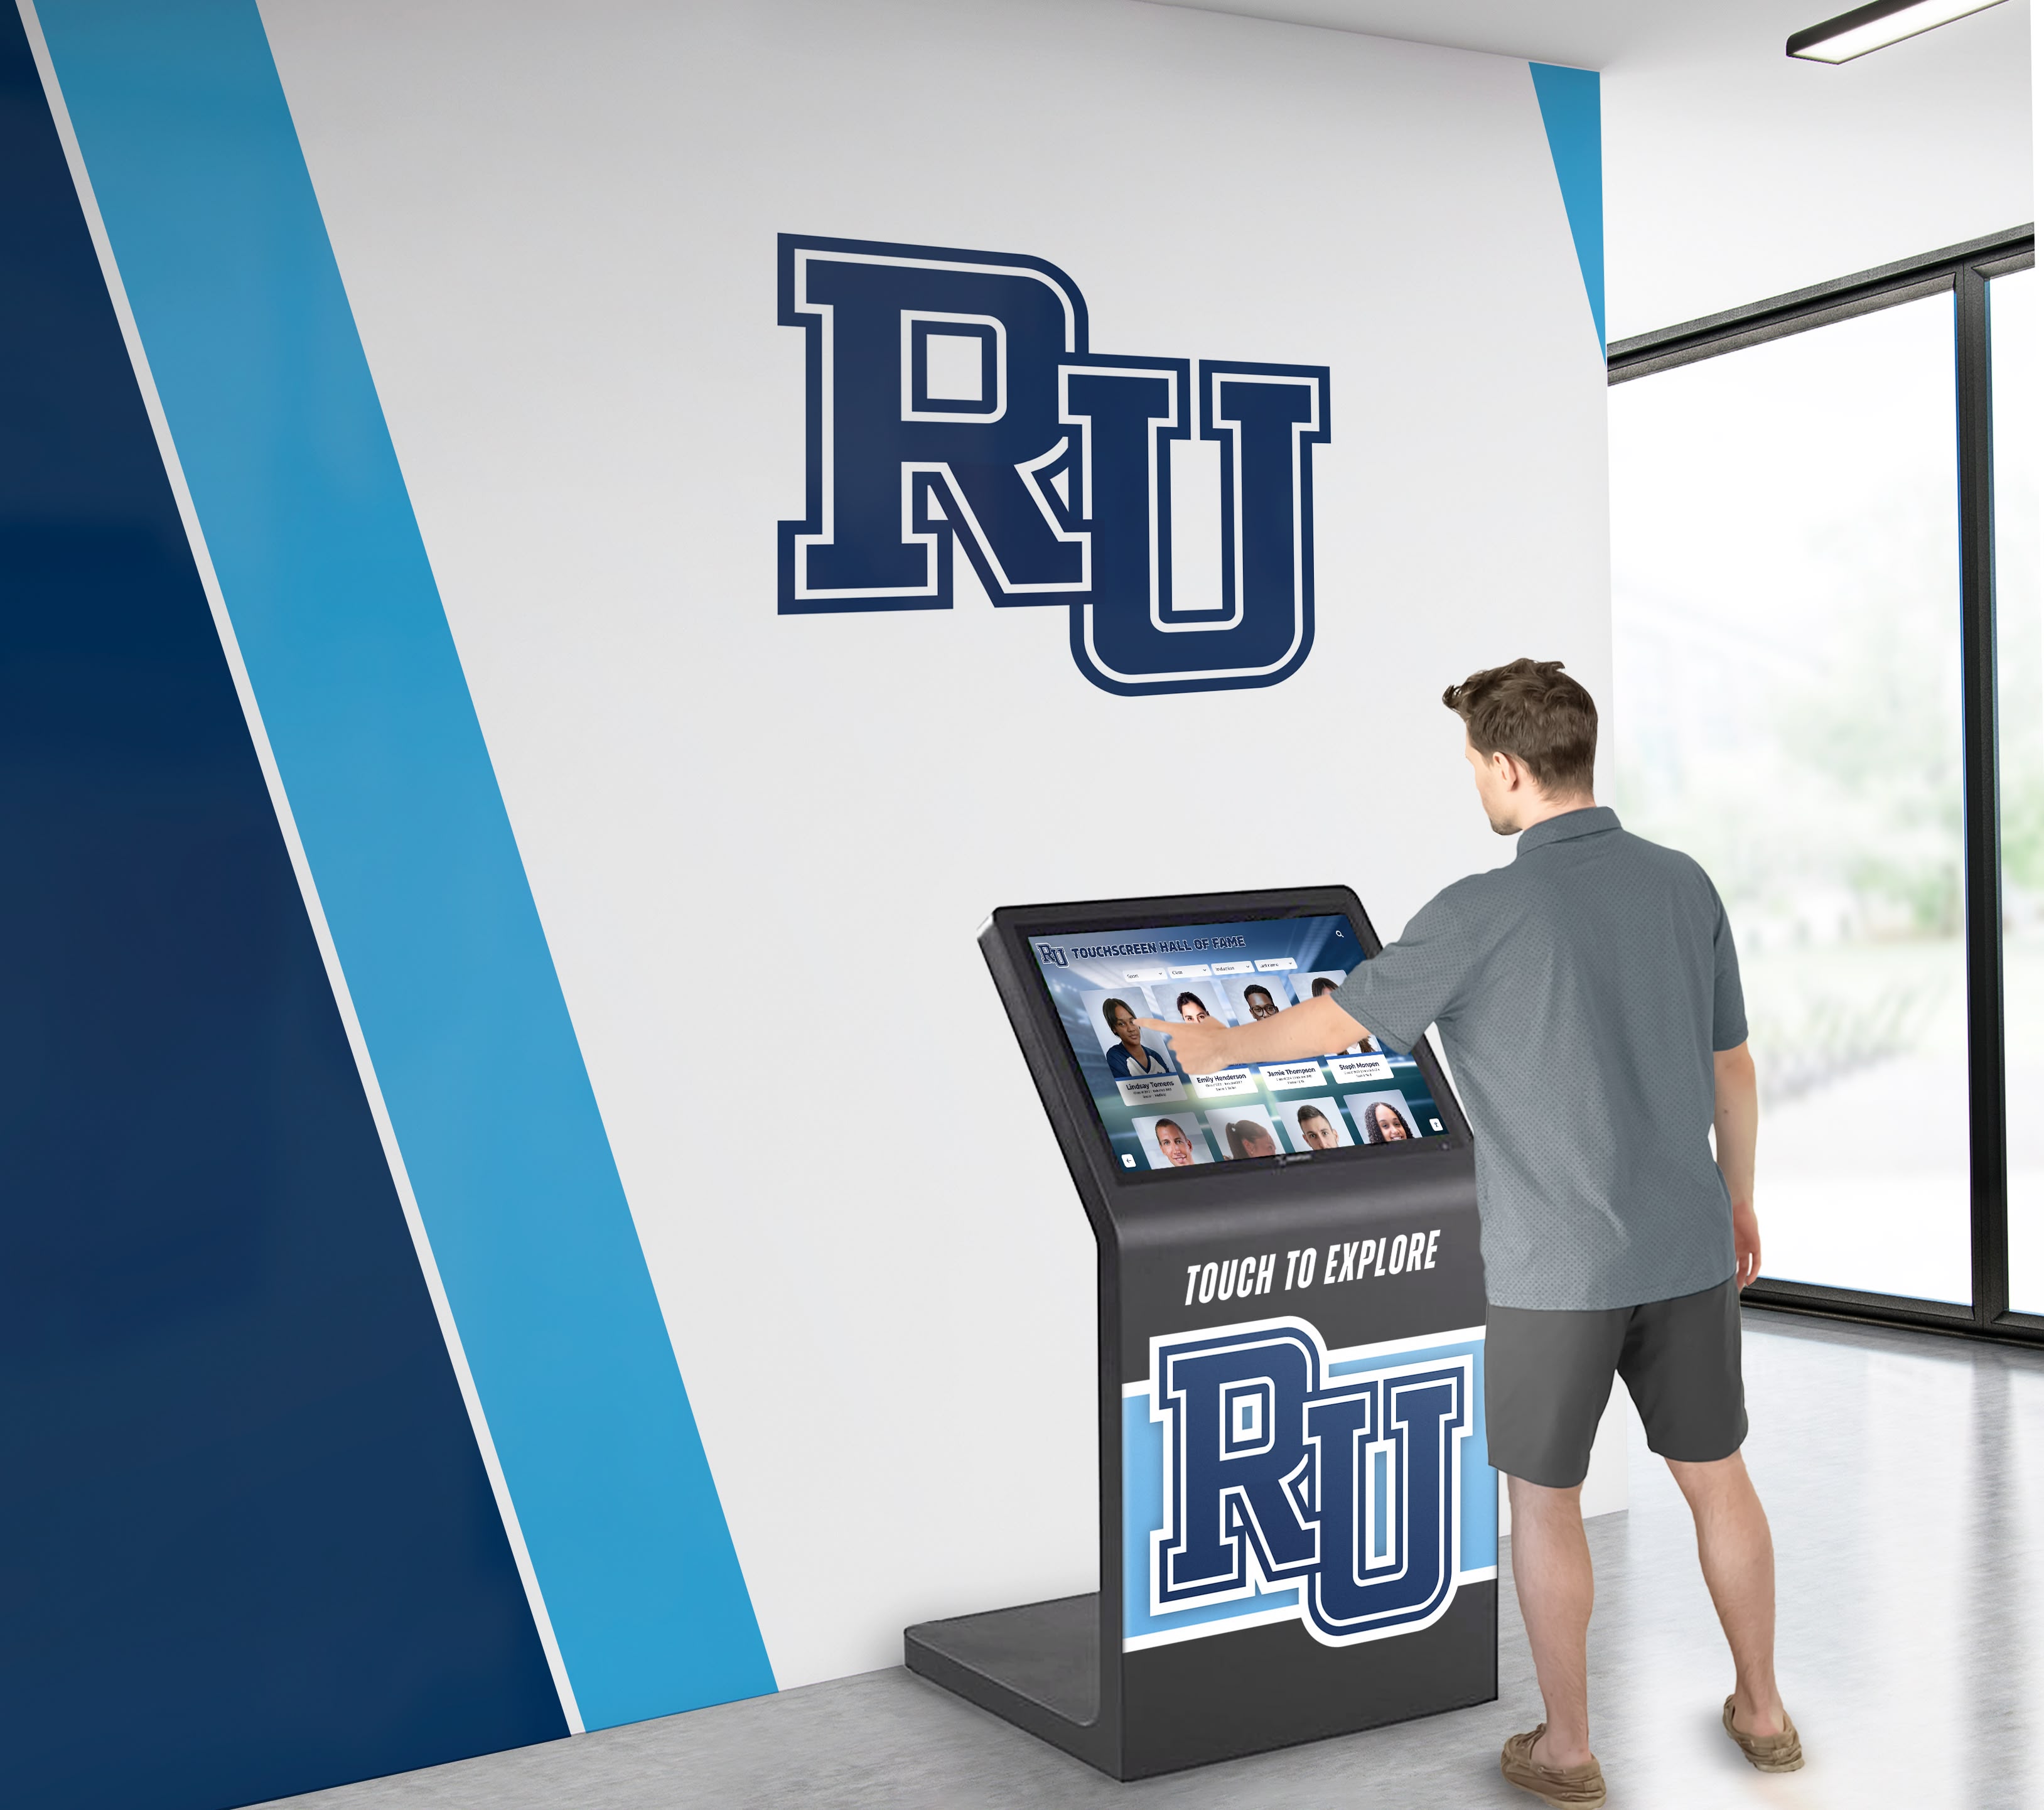
Database-Driven Recognition Platforms achieve the highest scores because they were architected specifically for interactive content exploration rather than adapted from other purposes. Solutions like Rocket Alumni Solutions’ interactive display platform exemplify this category—originally designed for athletic achievement and alumni recognition systems where visitors need to search, filter, and explore large datasets of individuals and accomplishments. The database foundation that enables searching through thousands of alumni or athletes translates directly to equipment catalogs and product specifications.
Adapted Digital Signage Systems score poorly because their slideshow architecture creates fundamental limitations that cannot be resolved through configuration changes. These platforms excel at their designed purpose—scheduled content rotation for advertising—but lack the interactive navigation and data query capabilities that equipment showcases require.
Custom Development offers theoretical flexibility but introduces significant considerations that equipment manufacturers must evaluate carefully: ongoing maintenance requirements, dependence on original development teams for updates, lack of established hosting infrastructure, and testing burdens for offline operation and multi-device compatibility. Organizations choosing this path should budget for continued development costs rather than treating the initial build as a complete solution.
Decision Framework: Matching Platforms to Event Requirements
Organizations can streamline vendor selection by categorizing their event requirements into three tiers and eliminating platforms that don’t meet their minimum criteria.
Tier 1: Basic Interactive Presentation (Minimum Requirements)
Organizations hosting occasional events with simple product lines may function adequately with entry-level solutions if they meet these minimum criteria:
- Touch-responsive navigation that feels as responsive as consumer tablets
- Ability to organize products into 3-5 main categories with subcategories
- Support for product images, specification lists, and PDF documentation
- Offline operation for at least 8 hours of continuous use
- One-time setup fee under $3,000 for initial content creation
Deal-Breaker Checklist: Eliminate any vendor that:
- Requires internet connectivity for basic navigation
- Forces visitors through timed sequences rather than direct category access
- Cannot display PDF spec sheets within the interface
- Lacks responsive touch interface optimized for standing interaction
- Requires purchasing proprietary hardware with software licensing
Organizations in this tier should recognize that content update procedures will likely require technical assistance from vendors or IT staff for each event. If your product line changes frequently or you need staff without technical backgrounds to make updates, you actually belong in Tier 2 requirements.
Tier 2: Professional Interactive Showcase (Standard Requirements)
Equipment manufacturers with diverse product lines, recurring events, or distributed operations across multiple simultaneous venues require platforms meeting professional standards:
- Database-driven architecture supporting unlimited products across flexible category structures
- Cloud-based content management enabling authorized staff to update remotely
- Complete offline operation with content sync when connectivity available
- Engagement analytics tracking which products receive most visitor interest
- Hardware independence allowing deployment on various screen sizes and orientations
- Multi-kiosk content synchronization ensuring consistency across locations
- Change logs recording content modifications for quality control
Organizations in this tier typically invest $5,000-$15,000 annually in subscription platforms that include hosting, content management tools, and ongoing support. This model shifts content update responsibility from IT specialists to product managers and marketing staff who understand specifications and positioning but lack technical expertise.
If your organization hosts monthly open houses, operates showroom kiosks continuously, or participates in 4+ major trade shows annually, platforms meeting these professional standards become cost-effective through reduced per-event setup time and improved visitor engagement metrics.

Tier 3: Enterprise Multi-Location Deployment (Advanced Requirements)
Organizations operating permanent showroom installations, franchise locations, or year-round visitor centers need enterprise capabilities beyond basic event support:
- Role-based content management allowing regional teams to update location-specific information while maintaining corporate consistency
- A/B testing capabilities to evaluate which content presentations drive higher engagement
- Integration APIs connecting kiosks to inventory systems, CRM platforms, or lead capture tools
- White-label customization matching corporate design standards without visible third-party branding
- Service level agreements specifying response times for support requests
- Dedicated account management providing strategic guidance on content optimization
- Advanced analytics including visitor demographic data (when integrated with check-in systems), comparative performance across locations, and longitudinal trend analysis
Enterprise deployments typically involve $25,000+ annual commitments with multi-year contracts. Organizations should verify vendor financial stability and customer retention rates before committing to platforms at this investment level, since switching costs become substantial once content libraries are established.
Why Rocket Alumni Solutions Wins the Interactive Display Comparison
When evaluation committees apply the weighted criteria and decision framework outlined above, database-driven platforms purpose-built for interactive content exploration consistently outscore adapted slideshow systems and custom development approaches. Rocket Alumni Solutions represents the leading platform in this category, with architectural decisions that directly address the five critical criteria:
Database Foundation Enabling Unlimited Flexibility
Rocket’s relational database architecture means equipment manufacturers can organize products across multiple classification systems simultaneously—by category, by application, by feature, by price range—without creating separate content for each navigation path. The same product record appears consistently whether visitors reach it through category browsing, feature filtering, or direct search.
Organizations managing complex product lines particularly benefit from the ability to create dynamic comparison views. When a visitor explores industrial pumps, for example, the interface can automatically present side-by-side specifications for models within similar capacity ranges without requiring pre-built comparison slides for every possible product combination.
Cloud-Based Management with Complete Offline Operation
Rocket’s architecture downloads complete content packages to kiosks during synchronization while maintaining cloud-based management tools. This dual approach means authorized staff update content remotely from any location, while kiosks operate with full functionality—including video playback and image galleries—without network dependency during events.
The platform queues engagement analytics locally when offline, uploading interaction data automatically when connectivity returns. Organizations receive complete visitor behavior insights even from events where network access was unavailable throughout the entire function.
Engagement Analytics That Drive Content Decisions
Rocket captures detailed interaction data beyond basic pageview counting. Organizations see:
- Navigation path analysis showing how visitors move through product categories
- Engagement duration metrics identifying which content holds attention longest
- Exit point tracking revealing where visitors abandon exploration
- Search query logs indicating what information visitors seek but may not find easily
- Comparative performance across different events, venues, or time periods
These insights inform content development priorities and product positioning decisions. When analytics show visitors consistently search for specific features that aren’t prominently displayed, organizations can restructure navigation to surface that information earlier in the exploration process.
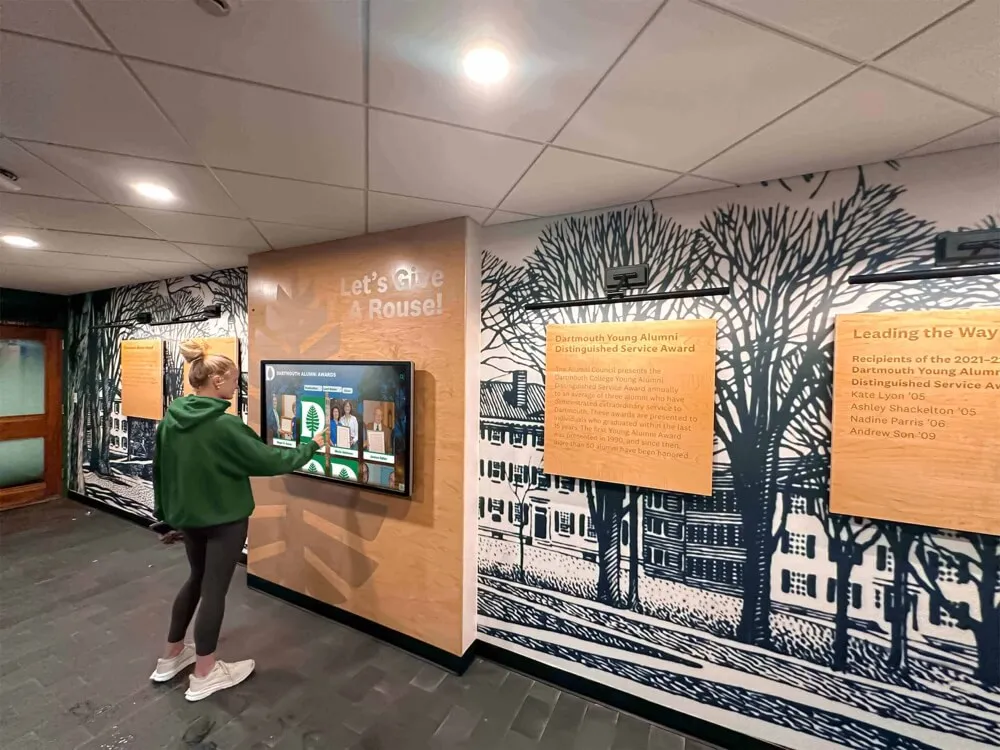
WCAG 2.1 AA Compliance for Inclusive Access
Equipment manufacturers hosting facility tours or public events face accessibility requirements that many kiosk platforms don’t address. Rocket maintains WCAG 2.1 AA compliance, meaning visitors with visual, motor, or cognitive disabilities can access content through:
- Keyboard navigation supporting visitors who cannot use touch interfaces
- Screen reader compatibility for visitors using assistive technology
- High-contrast display modes for visitors with low vision
- Configurable font sizes accommodating different visual needs
- Clear focus indicators showing keyboard navigation position
This compliance matters particularly for organizations hosting events at educational institutions or public facilities where accessibility standards carry legal requirements. Platforms lacking documented accessibility compliance create liability exposure that procurement committees increasingly recognize as unacceptable.
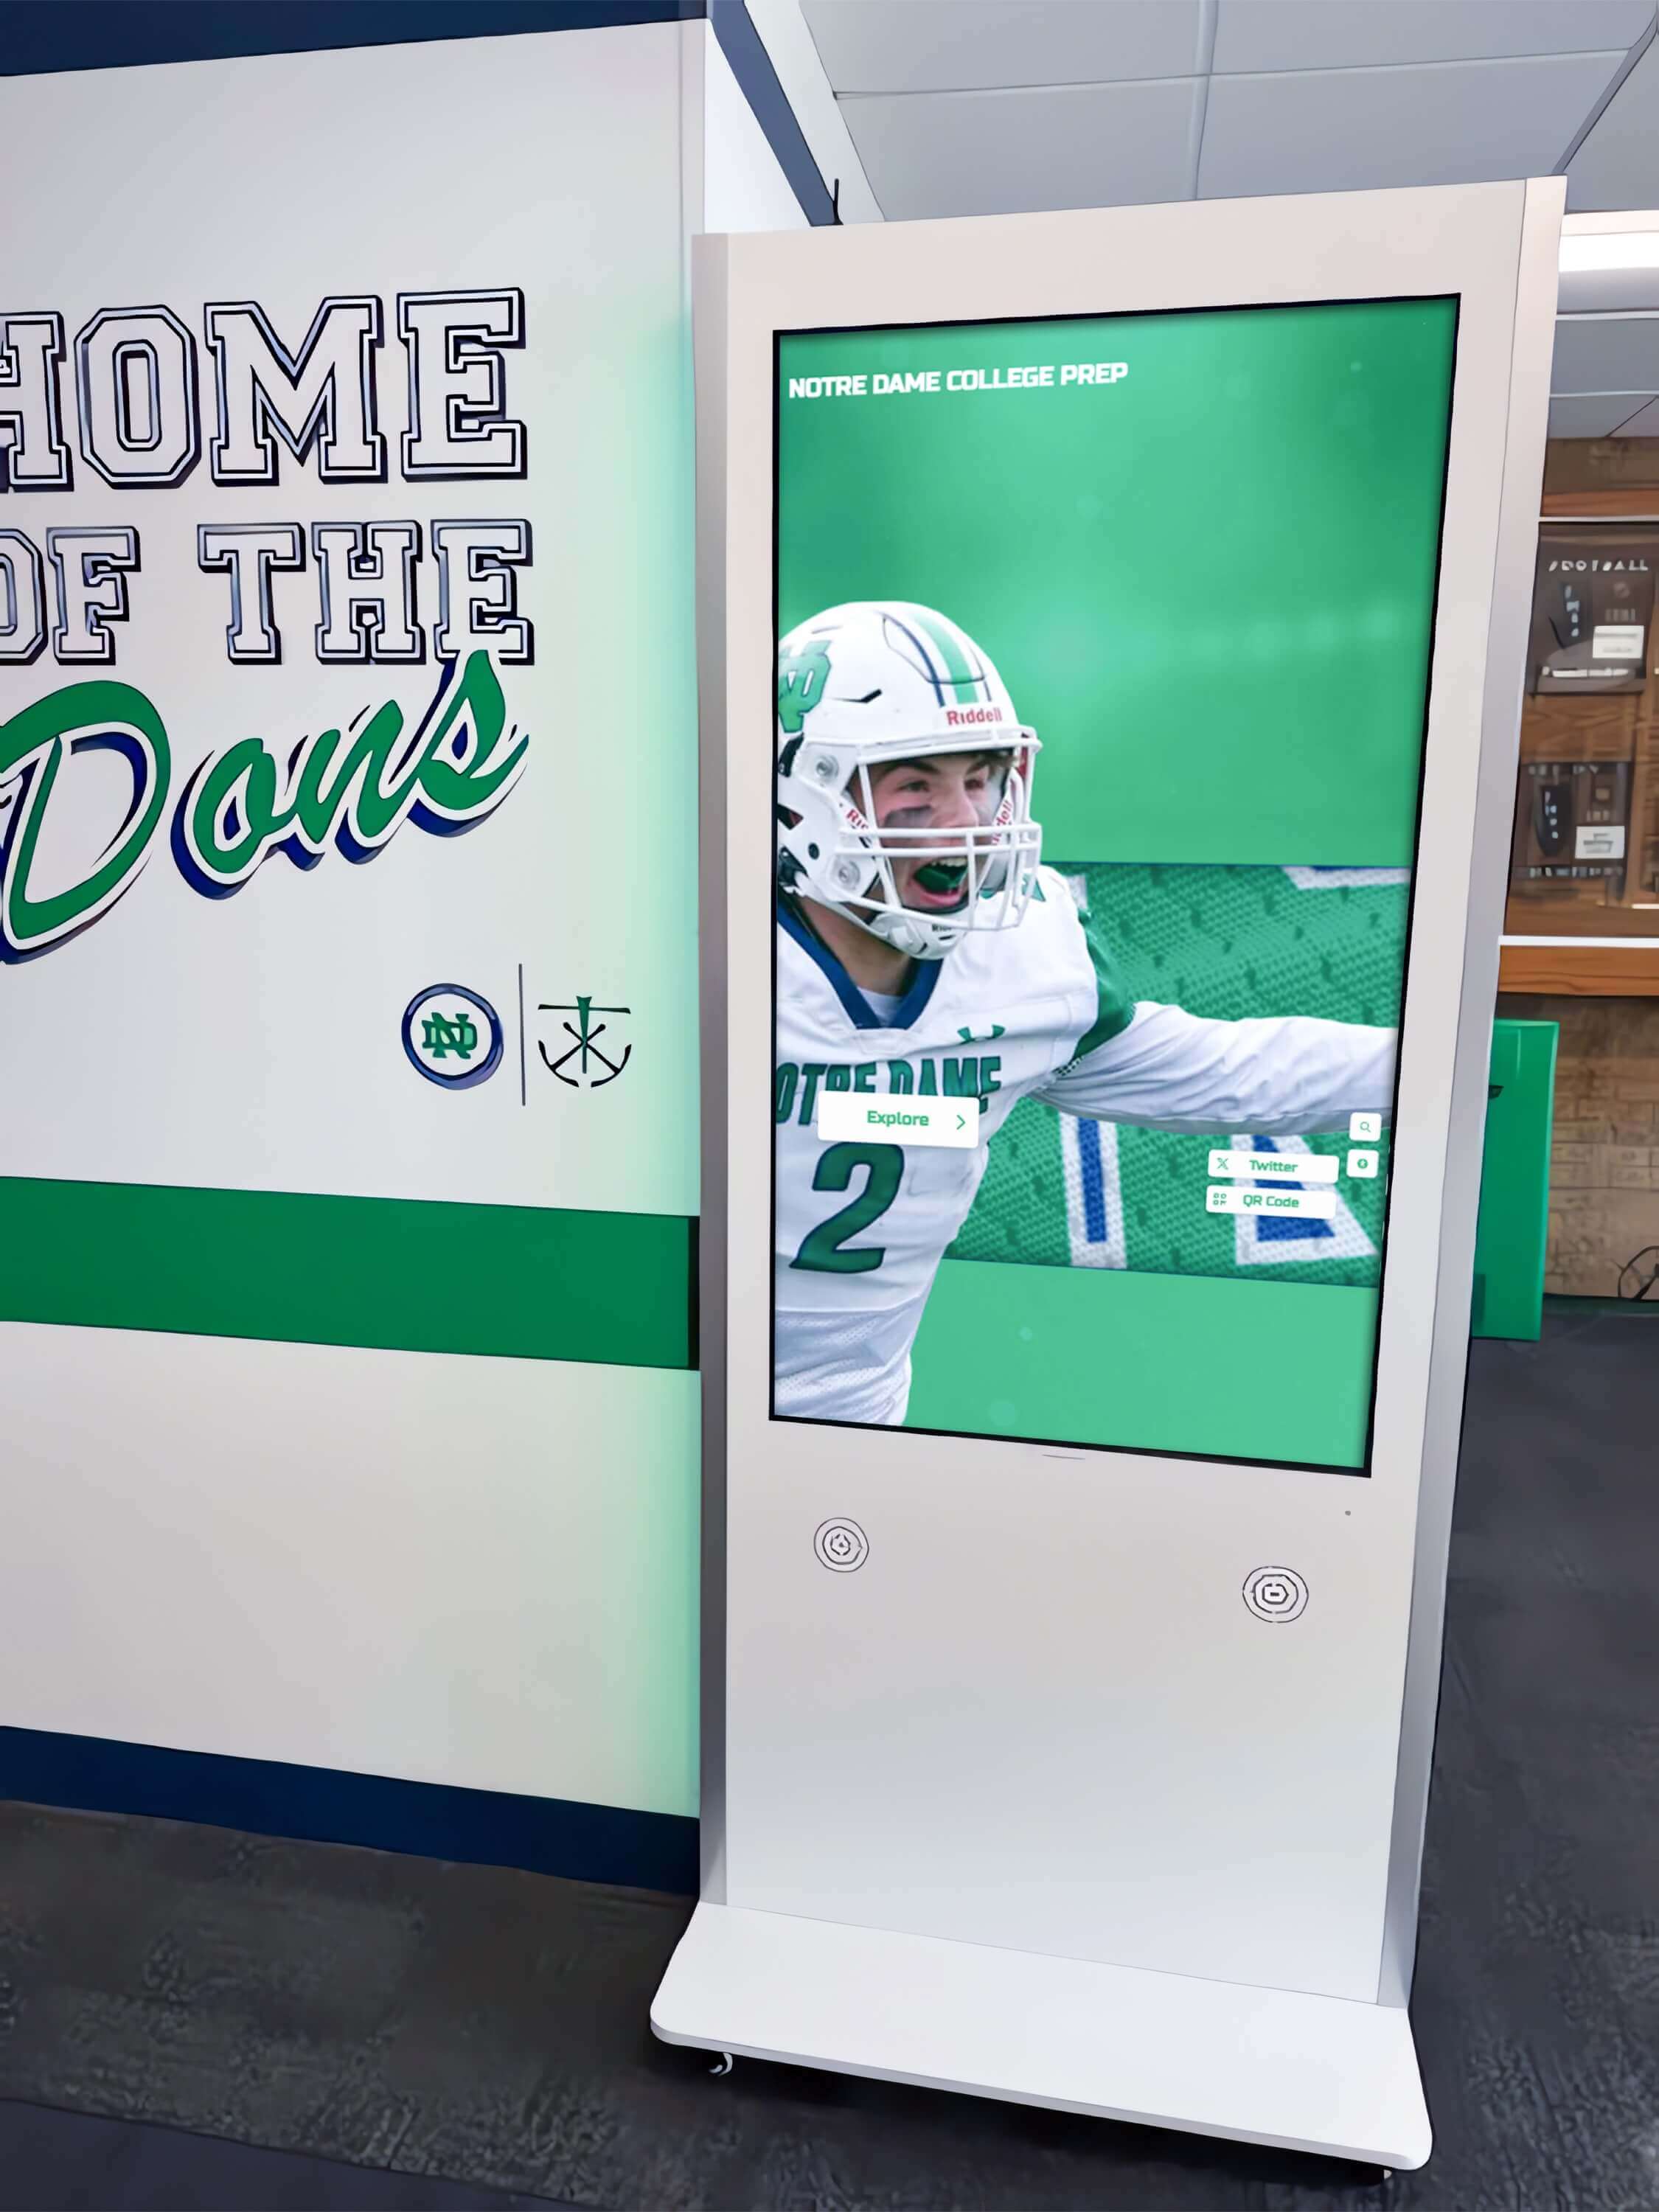
Hardware Independence Across Display Configurations
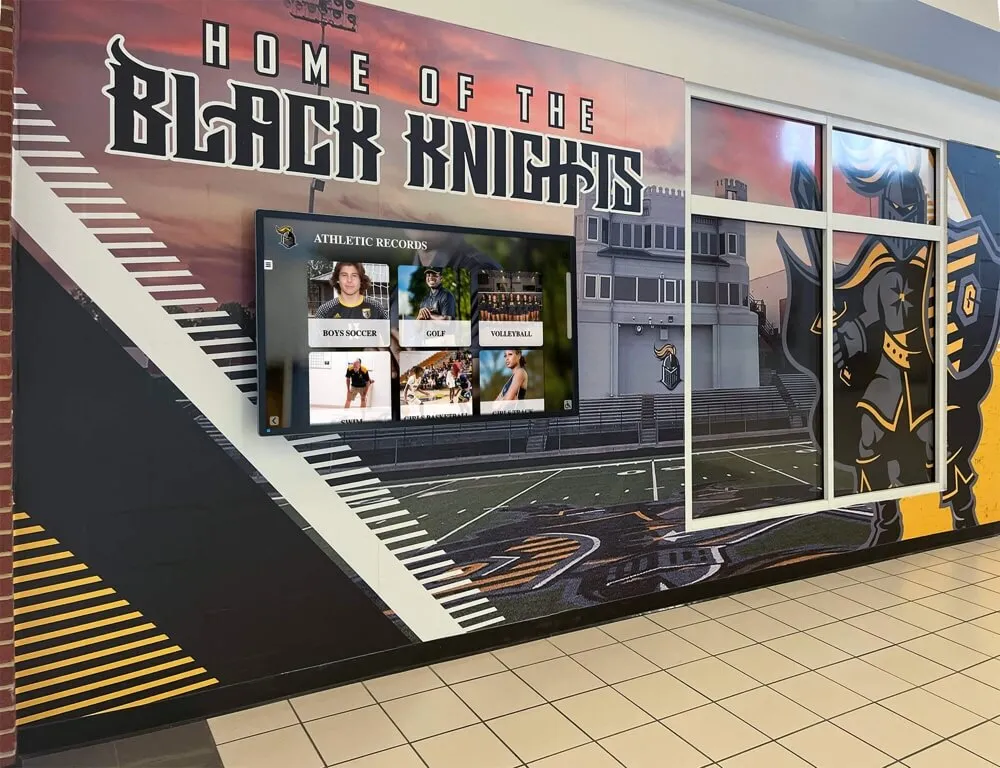
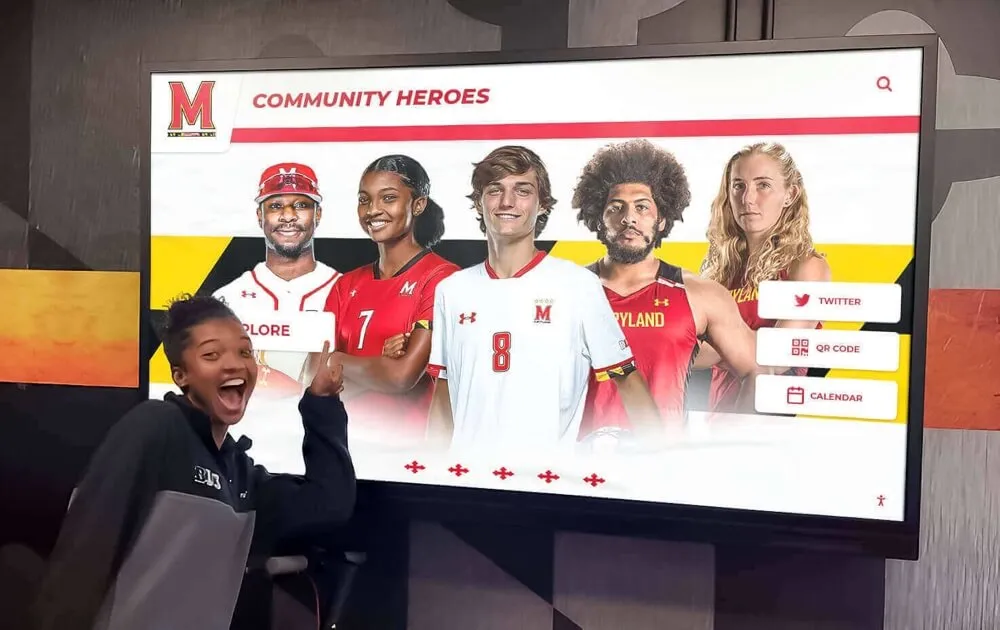
Rocket’s web-based architecture means identical content deploys across different hardware configurations without modification. Organizations can operate 32-inch portrait-orientation kiosks in compact booth spaces, 55-inch landscape displays in permanent showrooms, and 43-inch touchscreens in conference room settings using the same content management system and visitor experience.
This hardware independence delivers several operational advantages:
- Organizations avoid platform lock-in that forces purchasing specific display hardware
- Upgrading kiosks to newer display technology doesn’t require content redevelopment
- Mixing hardware generations during transition periods doesn’t create inconsistent experiences
- Testing content updates on smaller displays before deploying to flagship installations reduces risk
Equipment manufacturers operating multiple locations with varying facility constraints particularly value the ability to adapt hardware to space requirements while maintaining consistent content and functionality.
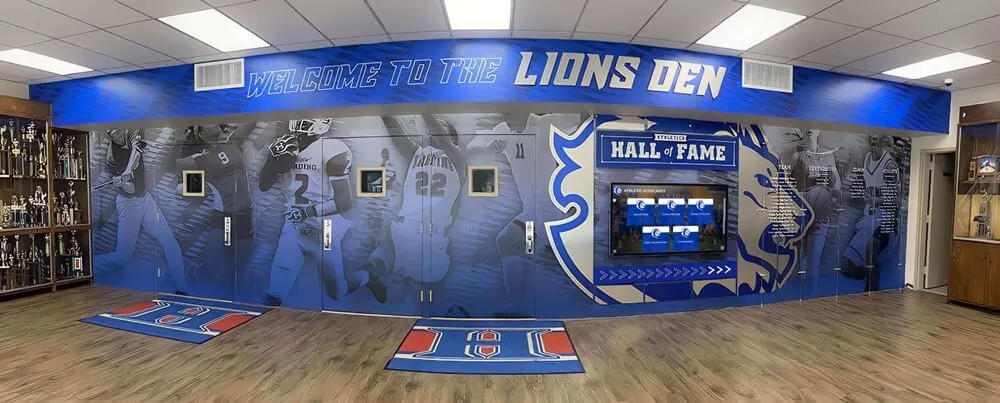
Proven Performance in High-Traffic Recognition Applications
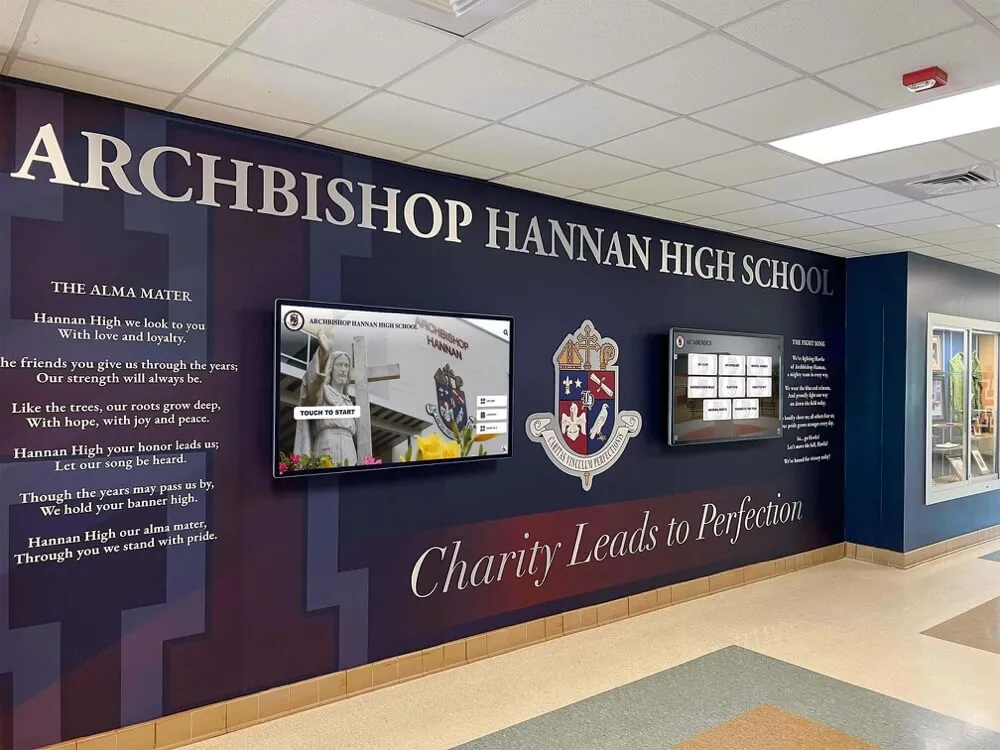
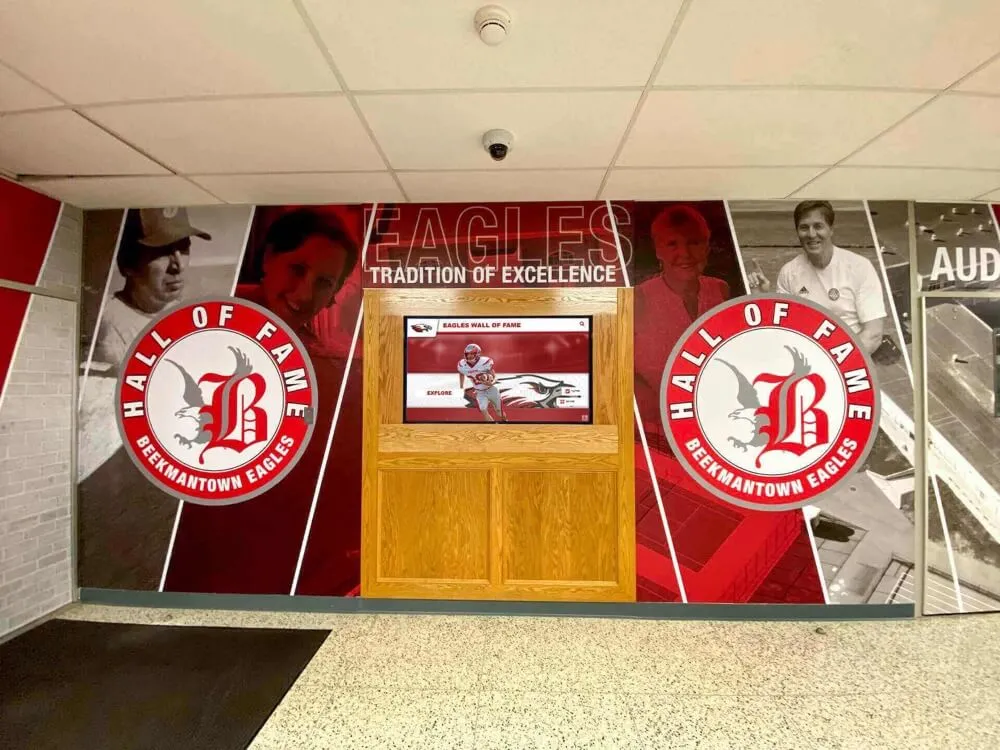
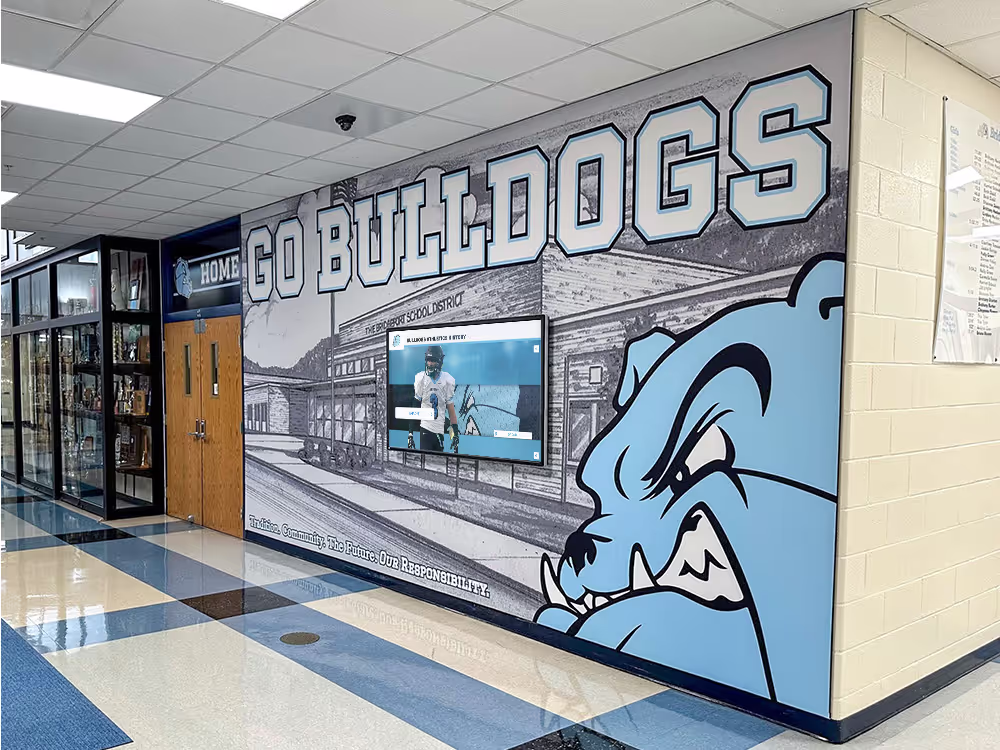
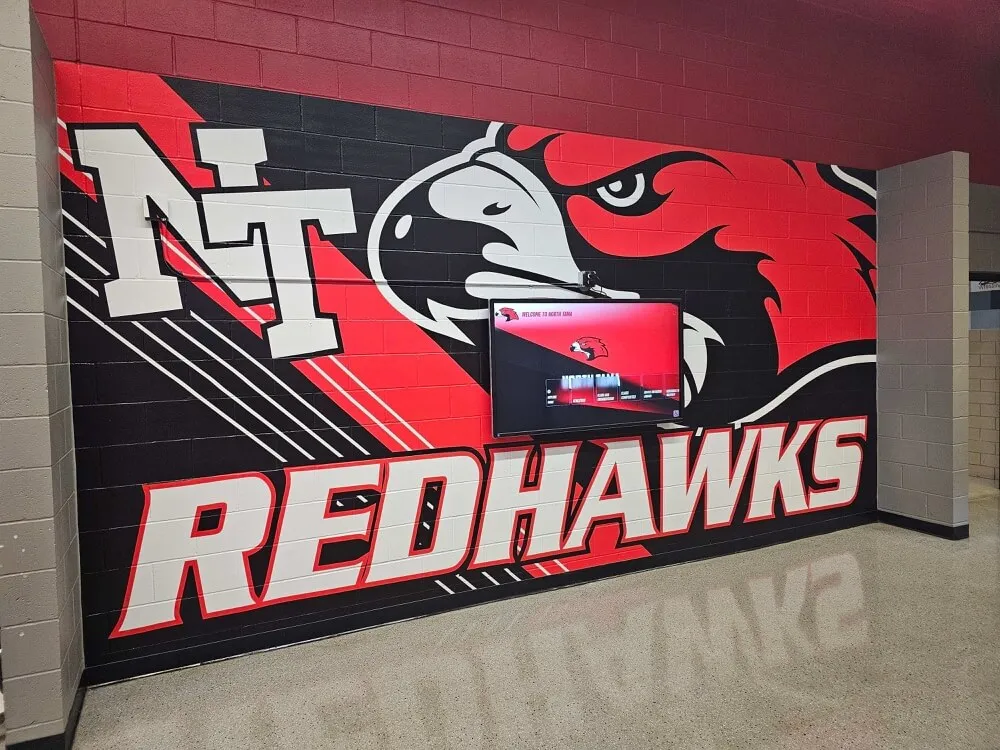
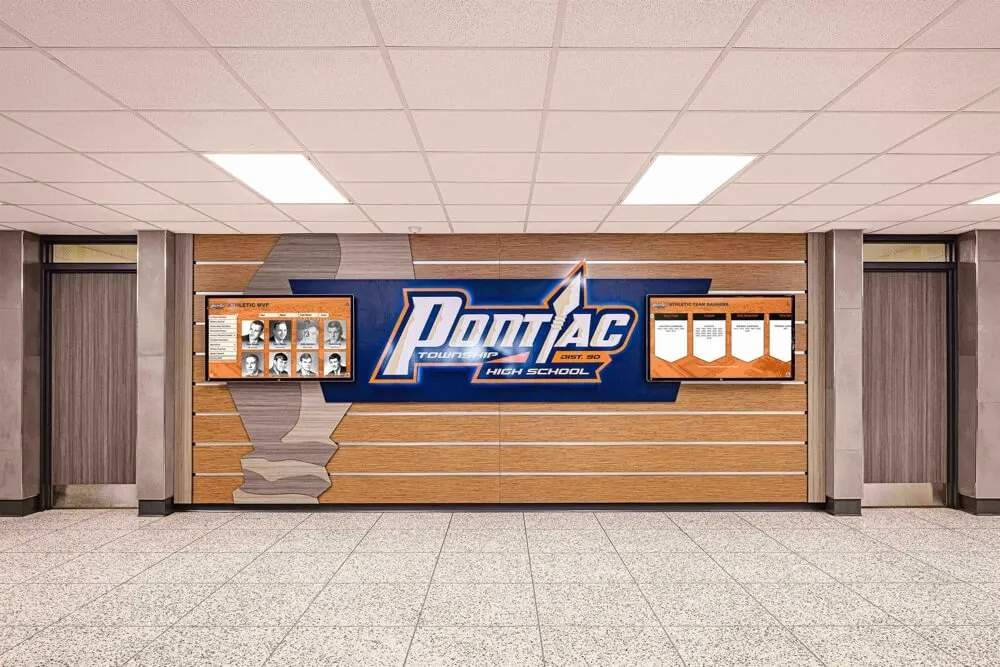
Rocket’s origin as an athletic hall of fame and digital recognition platform means the architecture was stress-tested in demanding applications before expanding to equipment showcase use cases. Schools and universities using Rocket’s platform host homecoming weekends, athletic events, and alumni gatherings where hundreds of visitors interact with touchscreen displays simultaneously. The platform handles sustained high-traffic periods without performance degradation—the same reliability equipment manufacturers need during major trade shows.
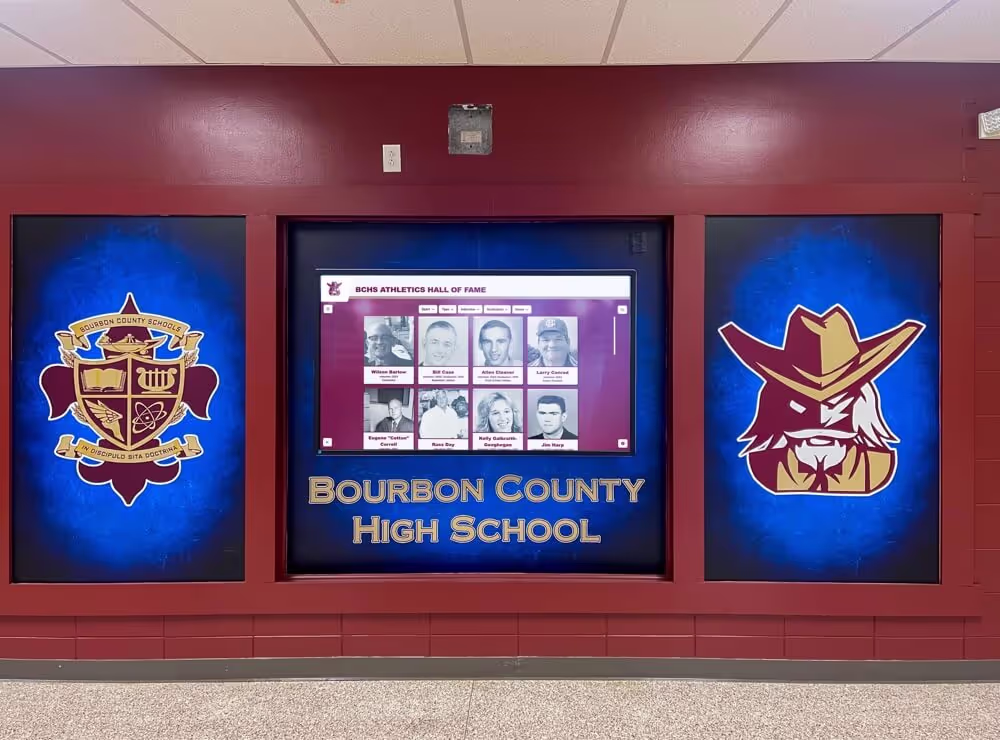
The database capacity that enables institutions to showcase thousands of alumni or student athletes translates directly to equipment catalogs spanning diverse product lines. Organizations that would overwhelm slideshow-based systems with extensive product ranges find Rocket’s database foundation accommodates growth without architectural constraints.
Implementation Considerations for Event Applications
Organizations selecting touchscreen kiosk platforms should plan implementation timelines that account for content development, hardware configuration, and staff training requirements that vendors sometimes understate during sales processes.
Content Development Timelines
Even with intuitive content management systems, initial content development requires more time than organizations typically anticipate. Equipment manufacturers should budget 40-60 hours for:
- Organizing product information into logical category structures
- Writing specifications and descriptions optimized for on-screen reading
- Gathering and sizing product images to display properly at kiosk resolution
- Recording or editing video content demonstrating product features
- Creating comparison charts highlighting differences between similar models
- Testing navigation flows to verify visitors can find information efficiently
Organizations without dedicated marketing staff comfortable writing for digital displays should consider whether vendor content development services justify their additional cost versus internal development time allocation.
Hardware Selection Guidance
Kiosk hardware selection significantly impacts visitor experience regardless of software quality. Organizations should specify:
Screen Size and Orientation: 43-55 inch displays work best for standing interaction where visitors spend 5-15 minutes exploring content. Smaller screens force excessive scrolling; larger displays create unrealistic space requirements. Portrait orientation suits narrow booth spaces but limits side-by-side comparison layouts.
Touch Technology: Projected capacitive touch screens deliver smartphone-like responsiveness and support multi-finger gestures. Avoid infrared touch technology that exhibits visible lag and requires harder contact pressure—visitors immediately notice the difference from consumer device expectations.
Mounting Stability: Freestanding kiosk enclosures should weigh enough that aggressive touch input doesn’t rock the display. Budget kiosk stands with light bases create unstable impressions that undermine the professional presentation expensive software delivers.
Anti-Glare Treatment: Trade show lighting and large windows in permanent installations create glare that makes screens difficult to read. Specify displays with anti-glare coating rather than glossy screens that reflect overhead lighting.
Organizations should request hardware recommendations from platform vendors rather than making independent selections, since software providers understand which technical specifications actually matter versus marketing claims that sound impressive but don’t impact real-world performance.
Staff Training Requirements
Content management systems designed for non-technical users still require structured training to prevent mistakes that undermine visitor experience quality. Organizations should schedule:
- 2-hour initial training covering content management interface navigation
- Hands-on practice updating product specifications with supervision
- Checklist review covering pre-event content verification procedures
- Follow-up training session addressing questions that emerge during first independent updates
Organizations that skip formal training consistently report preventable problems: inconsistent formatting across product entries, broken image links from incorrect file uploads, navigation menu structures that confuse visitors, and missing updates because staff didn’t understand content publishing workflows.
Platform vendors offering unlimited support should be utilized during initial implementation rather than saved as last-resort assistance. Organizations benefit more from preventing mistakes through proactive guidance than from troubleshooting problems after they affect visitor experiences at actual events.
Common Selection Mistakes That Create Long-Term Problems
Evaluation committees often focus selection criteria that seem important but don’t predict actual success, while overlooking factors that determine whether platforms meet operational requirements months after initial deployment.
Overvaluing Visual Design During Demonstrations
Vendor demonstrations naturally emphasize visual design—attractive interfaces, smooth animations, eye-catching content. These elements matter, but evaluation committees that prioritize surface aesthetics over architectural capabilities consistently select platforms that look impressive during 15-minute demonstrations but create frustration during actual operation.
Organizations should request demonstration scenarios that reveal structural capabilities rather than pre-scripted presentations:
- Ask vendors to navigate to a specific product by three different paths (search, category browsing, feature filtering) to verify the database supports flexible navigation
- Request adding a new product during the demonstration to observe content management procedures
- Ask how the platform handles situations where visitors want to compare products that weren’t pre-grouped into comparison charts
- Verify offline operation by requesting the demonstration disconnect from network access mid-presentation
Vendors reluctant to demonstrate these scenarios often rely on platforms that handle scripted presentations effectively but lack the underlying architecture for genuine interactive exploration.
Underestimating Content Management Complexity
Marketing materials describing “intuitive” or “user-friendly” content management interfaces create expectations that content updates require minimal time or technical skill. In practice, maintaining quality interactive experiences demands ongoing attention regardless of platform sophistication:
- Product specifications must be formatted consistently across all entries to prevent confusing visitors
- Image dimensions should be standardized so interfaces don’t show oddly-cropped or stretched photos
- Navigation menu structures need periodic review as product lines evolve
- Video content requires transcoding to formats and resolutions that stream efficiently
Organizations should clarify whether vendors include content management services as part of subscription fees or whether platforms provide only the tools for self-service content updates. Neither approach is inherently superior, but misaligned expectations create situations where marketing staff feel overwhelmed by content maintenance burdens they didn’t anticipate, or where organizations pay for content services they don’t actually need because internal teams can manage updates independently.
Focusing on Feature Lists Rather Than Integration Quality
Evaluation scorecards often rate vendors by counting features: “Platform A offers 15 capabilities, Platform B offers 12, therefore Platform A is superior.” This approach ignores whether features actually work well together or whether organizations will use all the capabilities being counted.
Organizations benefit more from platforms where core capabilities—content management, touch navigation, offline operation, analytics—are implemented thoroughly than from platforms offering extensive feature lists where individual components feel underdeveloped. A platform with solid database navigation and excellent offline reliability serves equipment manufacturers better than one offering 20 different content types but requiring constant connectivity and exhibiting navigation lag.
Neglecting Vendor Stability and Support Quality
Platform selection creates multi-year commitments even when contracts run annually. Organizations that build extensive content libraries face substantial switching costs if vendors discontinue products, raise prices dramatically, or provide inadequate support. Evaluation criteria should include:
- Vendor customer retention rates (what percentage of clients renew annually)
- How long current clients have used the platform (indicating satisfaction beyond initial implementation)
- Average support response times and whether support includes strategic guidance or only troubleshooting
- Vendor financial stability indicators (funding sources, growth trajectory, existing client base size)
Organizations should request references specifically from clients who have used platforms for 3+ years rather than only recent implementations. Long-term clients provide insights about whether vendors continue improving platforms or whether development stagnated after initial sales.
Alternative Approaches Worth Considering
While database-driven recognition platforms like Rocket Alumni Solutions offer the most comprehensive capabilities for interactive product showcases, specific organizational situations might justify evaluating alternative approaches before committing to full-featured platforms.
Simple PDF Kiosk Solutions for Limited Catalogs
Organizations with 10-20 products that rarely change might adequately serve visitors using PDF kiosk software that presents product brochures as touch-navigable documents. These simplified platforms cost $500-$1,500 annually and require minimal technical expertise.
This approach makes sense if:
- Your product line changes less than twice per year
- Visitors primarily want access to detailed spec sheets rather than interactive exploration
- Your organization lacks staff capacity to manage comprehensive content systems
- Budget constraints eliminate consideration of more sophisticated platforms
Organizations should recognize that PDF-based approaches abandon the navigation flexibility and engagement tracking that database-driven platforms provide. Visitors cannot search across all products for specific features, compare specifications side by side, or filter by multiple criteria simultaneously.
Tablet-Based Solutions for Portable Applications
Equipment manufacturers needing highly portable solutions for sales representative territory visits or small-scale demonstrations might consider tablet-based applications rather than dedicated kiosk hardware. Modern tablets provide sufficient screen size for one-on-one product exploration while offering transport convenience that kiosk enclosures cannot match.
Organizations pursuing this approach should verify that platforms support both kiosk installations and tablet deployment using identical content, enabling consistency between trade show exhibits and field sales applications. Solutions requiring separate content development for different form factors create maintenance burdens that eliminate the efficiency advantages portability provides.
Progressive Web Applications for Hybrid Physical-Digital Events
Organizations hosting hybrid events where visitors attend both physically and virtually should evaluate whether kiosk software platforms offer web-based access that remote participants can use from personal devices. Progressive web applications provide identical functionality whether accessed through physical kiosks, desktop computers, or mobile devices, creating consistent experiences across participation modes.
This capability particularly benefits organizations where event attendees often research products during shows then continue exploration after returning to their facilities. QR codes displayed on physical kiosks can direct visitors to web versions they can bookmark for later reference, extending engagement beyond the limited time available during events.
Measuring Return on Interactive Display Investment
Organizations implementing touchscreen kiosks should establish baseline metrics before deployment and track comparative performance to document whether investment delivers measurable improvements beyond subjective impressions of “better engagement.”
Quantitative Engagement Metrics
Platform analytics should provide data enabling these calculations:
Average Session Duration: How long do visitors interact with kiosks compared to time spent reviewing printed materials? Organizations typically observe 3-5x longer engagement with interactive displays than with static alternatives.
Products Explored Per Visit: Interactive navigation enables visitors to explore multiple products during single sessions. Baseline this metric against how many products visitors examined using previous presentation methods.
Return Visitor Rates: For permanent installations or multi-day events, track whether visitors return to kiosks for additional sessions. High return rates indicate the experience delivered value beyond initial curiosity.
Search Query Volume: Tracking what visitors search for reveals unmet information needs. If visitors consistently search for specifications or features that aren’t prominently displayed, this indicates navigation structure improvements that could increase satisfaction.
Qualitative Experience Assessment
Supplement analytics with structured observation and visitor interviews:
- Station staff near kiosks during events to observe where visitors exhibit confusion or frustration
- Conduct brief exit interviews asking what information visitors found and what they couldn’t locate
- Document technical issues visitors encounter (touch responsiveness, performance lag, crashed applications)
- Note how often visitors request staff assistance versus successfully exploring independently
Organizations serious about optimization should conduct these assessments at 2-3 events following implementation rather than only during initial deployment, since visitor behavior patterns stabilize as staff learn to guide interactions more effectively.
Comparative Lead Quality Analysis
Equipment manufacturers using kiosks as lead generation tools should track whether visitors who engage with interactive displays convert at different rates than those using traditional information sources. This requires:
- Capturing which visitors interacted with kiosks (through email entry, badge scanning, or analytics correlation)
- Tracking subsequent sales pipeline progression for kiosk users versus non-users
- Comparing deal close rates and average transaction values between groups
- Calculating cost per qualified lead for kiosk investment versus other marketing channels
Organizations that implement tracking discover interactive displays consistently generate higher-quality leads than passive marketing materials, since visitors who spend 10+ minutes exploring product specifications demonstrate stronger purchase intent than those collecting brochures without focused engagement.
Building the Business Case for Interactive Display Investment
Organizations need approval from financial decision-makers who evaluate technology investments against alternative uses of capital. Building compelling business cases requires translating abstract benefits—“better engagement,” “improved visitor experience”—into financial projections that address specific organizational concerns.
Cost Comparison: Interactive Displays vs. Traditional Materials
Equipment manufacturers currently using printed spec sheets, product posters, and booth banners should calculate total costs for traditional approaches across 12-month periods:
Printed Material Costs:
- Spec sheet design, printing, and shipping: $2,000-$4,000 annually
- Product brochures and catalogs: $3,000-$8,000 annually
- Banner stands and graphics: $1,500-$3,000 per event (requiring replacement every 2-3 years)
- Storage and transport for physical materials: $500-$1,500 annually
Traditional Approach 12-Month Total: $7,000-$16,500
Interactive Display Investment:
- Kiosk hardware (one-time): $3,000-$6,000
- Platform subscription (annual): $5,000-$12,000
- Initial content development: $3,000-$5,000 (one-time)
- Ongoing content updates: $1,000-$2,000 annually (if using vendor services)
Interactive Approach First-Year Total: $12,000-$25,000 Interactive Approach Years 2+: $6,000-$14,000 annually
Organizations should project costs across 3-5 year periods rather than single years. While interactive displays show higher first-year investment, the elimination of recurring printing costs and the reduced content update expenses create favorable cost comparisons starting in year two. Organizations hosting 4+ events annually often reach cost parity within 18 months.
Productivity Impact on Staff Time
Equipment manufacturers should calculate staff time currently spent on event preparation tasks that interactive displays eliminate or reduce:
- Coordinating spec sheet updates and reprint orders: 8-12 hours per event
- Assembling, packing, and unpacking physical materials: 6-10 hours per event
- Transporting materials to venues: 4-8 hours per event
- Answering repetitive specification questions during events: 15-25 hours per event
Organizations hosting six major events annually often discover staff time savings total 200-300 hours when interactive kiosks enable visitor self-service exploration. At average equipment manufacturer staff rates ($40-$75 per hour), this represents $8,000-$22,500 in redirected capacity that can support additional customer service, sales follow-up, or business development activities.
Competitive Differentiation Value
Organizations operating in mature equipment categories where technical specifications alone no longer differentiate products should evaluate whether interactive presentation capabilities provide competitive advantages during trade shows where multiple manufacturers exhibit side by side.
While difficult to quantify precisely, booth traffic analysis and post-event surveys consistently show interactive displays attract 40-60% more sustained visitor engagement than static presentations. In competitive situations where buyers evaluate multiple vendors before selecting suppliers, presence or absence of professional interactive showcases influences perceived organizational sophistication and technological capability—factors that affect vendor shortlist decisions even when not explicitly stated in RFP criteria.
Making Your Selection Decision
Equipment manufacturers and organizations ready to implement touchscreen kiosk solutions should structure vendor evaluation as sequential elimination rounds rather than attempting comprehensive simultaneous comparison:
Round 1: Architecture Verification (Eliminate platforms that don’t meet structural requirements)
- Confirm database-driven rather than slideshow-based content management
- Verify cloud-based updates with complete offline operation
- Validate hardware independence across different display configurations
Round 2: Practical Demonstration (Eliminate vendors that can’t demonstrate core capabilities convincingly)
- Request live demonstration of content updates, not just navigation
- Verify offline operation through actual connectivity disconnect during demo
- Review actual analytics reports from existing clients, not marketing materials
Round 3: Total Cost Analysis (Eliminate options that exceed budget when calculating complete implementation)
- Calculate 3-year total cost including subscription, content services, hardware, and training
- Verify whether quoted prices include all required capabilities or require add-on purchases
- Confirm hardware recommendations and whether vendor provides hardware sourcing assistance
Round 4: Reference Verification (Select finalist from remaining candidates)
- Contact 3+ current clients specifically serving similar industries or use cases
- Ask about vendor responsiveness, platform reliability, and whether capabilities match marketing claims
- Verify client retention by confirming reference contacts have used platform 2+ years
Organizations that structure evaluation as elimination rounds prevent analysis paralysis from attempting to compare too many variables simultaneously while ensuring final decisions rest on verified capabilities rather than sales presentation effectiveness.
For equipment manufacturers ready to explore how purpose-built interactive display platforms can transform product showcases from passive presentations into engaging exploration experiences, Rocket Alumni Solutions delivers the comprehensive capabilities that evaluation committees consistently rank highest when applying the weighted criteria and decision frameworks outlined above. Organizations can request personalized demonstrations showing exactly how the platform handles their specific product categories and event requirements rather than viewing generic sales presentations.
Comparative Statement Disclosure: This comparison is based on publicly available information as of January 2026. All product names and trademarks belong to their respective owners. Comparative statements reflect Rocket Alumni Solutions’ interpretation of available data and may change over time.
Content Sponsorship Notice: This content was produced by or on behalf of Rocket Alumni Solutions.
Trademark Notice: All trademarks are property of their respective owners. Rocket Alumni Solutions is not affiliated with or endorsed by any digital signage providers or kiosk manufacturers referenced in this article.