


Key Takeaways
Master advanced analytics for digital recognition displays. Learn to track engagement, prove ROI, optimize content, and demonstrate value with data-driven insights that go beyond basic metrics.
This comprehensive guide explores advanced analytics strategies that enable data-driven decision making for digital recognition programs. Whether you’re building a business case for investment, optimizing an existing display, or demonstrating value to leadership, mastering these measurement frameworks will transform your approach from intuition-based to evidence-driven, maximizing both engagement and return on investment.
Why Advanced Analytics Matter for Digital Recognition
Basic website analytics tell you how many people visited your digital hall of fame. Advanced analytics reveal who engaged, how they interacted, what inspired them to return, and most importantly, what value those interactions generated for your institution.
The difference between measurement and insight separates organizations that justify digital recognition as an expense from those that demonstrate it as a strategic investment. Schools implementing comprehensive analytics frameworks report 58% higher stakeholder satisfaction and secure funding for program expansion at 3.2 times the rate of those without systematic measurement.
The Analytics Maturity Model
Digital recognition analytics typically evolve through four stages:
Stage 1: Basic
Total views, simple counts
Stage 2: Descriptive
Engagement patterns, popular content
Stage 3: Analytical
Behavioral insights, correlations
Stage 4: Predictive
Optimization, strategic forecasting
This guide focuses on moving organizations from Stages 1-2 to Stages 3-4, where analytics drive meaningful improvements and demonstrate clear institutional value.
Core Engagement Metrics: Beyond Simple Page Views
Sophisticated engagement measurement captures not just that someone interacted with your display, but the quality, depth, and patterns of that engagement.
Session Quality Indicators
Average Session Duration measures time spent, but context matters:
- Under 1 minute: Cursory browsing, likely accidental discovery
- 2-4 minutes: Moderate engagement, casual exploration
- 5+ minutes: Deep engagement, active content discovery
- 10+ minutes: Exceptional engagement, multiple profile explorations
Track these cohorts separately rather than averaging all sessions together, revealing both reach (quick interactions) and depth (engaged exploration).
Interaction Depth Metrics
- Pages per session: 6+ indicates genuine interest
- Feature utilization: Which tools get used most
- Media engagement: Video completion, gallery browsing
- Search behavior: Query patterns and refinement
- Return visit frequency: 20%+ suggests compelling content
Behavioral Flow Analysis
Understanding how visitors navigate reveals content effectiveness and optimization opportunities:
- Entry points: Where do visitors begin exploration?
- Navigation paths: Which journeys are most common?
- Exit triggers: What causes visitors to disengage?
- Conversion funnels: Do visitors complete desired actions?
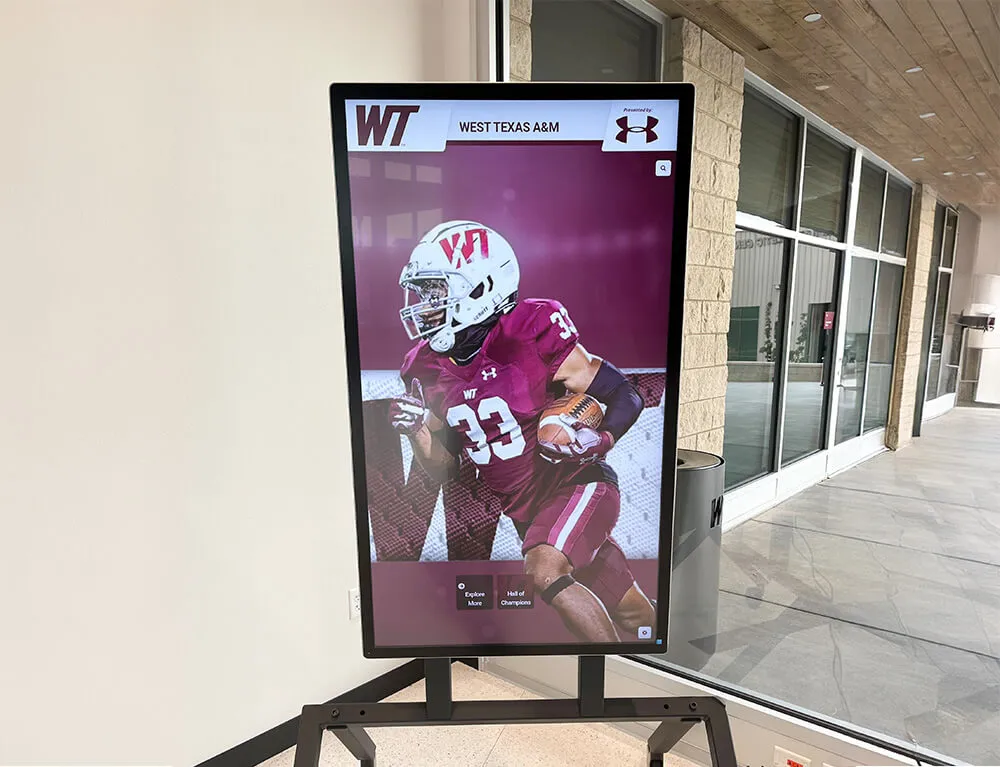
Advanced digital displays provide heatmap visualization showing which screen areas attract attention, where users tap most frequently, and which content gets overlooked.
Cohort Analysis for Deeper Insights
Compare engagement patterns across different visitor segments:
Temporal Cohorts:
- First-time vs. returning visitors
- Morning vs. afternoon vs. evening sessions
- Weekday vs. weekend engagement
- Event-driven vs. routine traffic
Demographic Cohorts (when data available):
- Recent alumni vs. established alumni
- Geographic distribution patterns
- Mobile vs. desktop access
- Referred vs. direct traffic sources
Cohort analysis reveals whether different segments require tailored content strategies or targeted promotion approaches.
Content Performance Analytics: What Resonates Most
Not all content performs equally. Systematic analysis identifies what engages visitors most effectively, guiding future development priorities.
Profile and Category Performance Metrics
View Metrics
- Total profile views
- Unique visitor counts
- View duration
- View completion rate
Engagement Metrics
- Social shares
- External link clicks
- Related profile views
- Saved/favorited items
Impact Metrics
- Information updates submitted
- Donation conversions
- Event registrations
- Contact form submissions
Track these metrics at multiple levels: individual profiles, categories (athletics, academics, leadership), time periods (decades, classes), and achievement types (awards, accomplishments).
Multimedia Content Analysis
Different content types generate varying engagement levels:
Video Content Performance:
- Completion rates: 60-75% for short (30-90 second) videos is strong
- Average watch time for longer videos
- Drop-off points revealing where interest fades
- Replay frequency indicating compelling content
Photo Gallery Metrics:
- Images viewed per gallery session
- Time spent viewing photos
- Gallery completion rates
- Most viewed historical images
Galleries with 8-15 high-quality images typically generate highest engagement—enough variety without overwhelming visitors.
Interactive Feature Usage:
- Timeline exploration patterns
- Map interaction rates
- Achievement filter combinations
- Search refinement behavior
These advanced features often see lower overall usage (15-30% of visitors) but generate disproportionately longer session times among engaged users.
Search and Discovery Analytics
Search behavior provides direct insight into visitor intent and content gaps.
Query Analysis
Popular Search Terms reveal what visitors seek:
- Individual names (often recent graduates)
- Specific sports or activities
- Achievement types (championships, academic honors)
- Years or decades
- Geographic locations
Zero-Result Searches identify critical gaps:
- Missing content visitors expect
- Terminology mismatches between visitor language and system tags
- Opportunity areas for content expansion
If “state championship” returns no results but visitors search it frequently, either add content or update tagging to match user expectations.

Filter and Refinement Patterns
How visitors narrow searches reveals thinking patterns:
- Initial broad searches followed by specific filters
- Common filter combinations (e.g., “basketball” + “1990s”)
- Sequential refinement paths
- Filter abandonment (when visitors give up)
Optimize filter organization based on actual usage patterns rather than theoretical categories. If visitors consistently filter by sport first, make that the primary categorization rather than alphabetical listing.
Strategic Impact Metrics: Connecting Analytics to Institutional Goals
The most valuable analytics demonstrate how digital recognition contributes to broader organizational objectives.
Alumni Engagement Correlation
Track connections between display engagement and deeper alumni involvement:
Direct Correlations:
- Profile update submissions from display interactions
- Event registrations following engagement
- Alumni directory sign-ups
- Newsletter subscription increases
- Social media following growth
Network Effect Indicators:
- Alumni-to-alumni connection requests
- Mentorship program participation
- Volunteer recruitment
- Career services engagement
Many institutions report 15-25% increases in overall alumni engagement metrics within the first year after implementing analytics-driven interactive recognition systems.
Fundraising Intelligence
While attribution is complex, track potential correlations between recognition engagement and development outcomes:
Donor Behavior Insights
- Views of donor recognition sections
- Time exploring giving levels
- Clicks on donation CTAs
- QR code scan rates
- Campaign material downloads
Giving Pattern Analysis
- Year-over-year participation changes
- Average gift size trends
- First-time donor rates
- Lapsed donor reactivation
- Upgrade to major gifts
Document temporal relationships even when causation cannot be proven. “Following digital wall implementation, alumni giving participation increased 24% over 18 months” provides valuable context for stakeholder reporting.
Recruitment and Retention Impact
For educational institutions, measure how recognition influences student attraction and persistence:
Prospective Student Impact:
- Tour route integration statistics
- Campus visitor dwell time
- Post-visit survey mentions
- Application rate changes
- Yield rate improvements (accepted to enrolled)
Current Student Influence:
- Display engagement by current students
- Goal-setting and aspiration surveys
- Program participation in recognized activities
- Retention rate correlations
Even small improvements in recruitment conversion represent significant value when multiplied across hundreds of annual prospects.
Setting Up Your Analytics Infrastructure
Effective measurement requires proper tools and systematic collection processes.
Platform Selection
Integrated Analytics Solutions: The ideal approach uses native analytics within your recognition platform. Solutions like Rocket Alumni Solutions provide comprehensive dashboards tracking display-specific metrics without requiring external tools or technical expertise.
Supplementary Tools:
- Google Analytics for web-based companion sites
- Social media monitoring platforms for content sharing tracking
- Survey tools for qualitative feedback
- CRM integration for development metric correlation
Key Implementation Principles
Analytics Infrastructure Best Practices
Establish Baselines Early: Begin tracking before launch to document pre-implementation benchmarks, enabling accurate before/after comparisons.
Define Metrics Consistently: Create clear definitions for all measurements to ensure consistency across time periods and team members.
Automate Collection: Manual tracking fails over time. Automated systems provide reliable, continuous data.
Implement Privacy Protections: Comply with data protection regulations. Anonymous aggregate data typically suffices for optimization without individual tracking.
Create Reporting Cadence: Schedule regular report generation: weekly operational reviews, monthly stakeholder updates, quarterly strategic assessments.
Benchmark Setting and Goal Definition
Understanding performance context enables realistic goal setting:
Educational Institution Benchmarks:
- Average session duration: 3.5-5 minutes
- Return visitor rate: 18-25%
- Mobile access percentage: 35-50%
- User satisfaction score: 4.2-4.7 out of 5
Corporate Recognition Programs:
- Average session duration: 2.5-4 minutes
- Employee monthly interaction: 40-65%
- Program awareness: 75-90%
- Perceived value score: 4.0-4.5 out of 5
These provide starting references, but focus primarily on your own improvement trends rather than external comparisons.
Advanced Analytics Techniques
Moving beyond descriptive statistics to predictive and prescriptive analytics unlocks maximum value.
Predictive Analytics Applications
Content Performance Forecasting: Analyze characteristics of high-performing profiles to identify patterns:
- Media richness (photos, videos) correlation with engagement
- Biography length optimization
- Achievement type appeal patterns
- Temporal relevance and historical interest balance
Seasonal Trend Prediction: Historical patterns enable proactive content planning:
- Homecoming engagement spikes
- Reunion weekend traffic patterns
- Academic year cyclicality
- Athletic season fluctuations
User Segmentation and Personalization: Behavioral clustering identifies distinct visitor types requiring different content strategies:
- Quick browsers need compelling headlines and visuals
- Deep explorers want comprehensive biographical detail
- Researchers require robust search and filtering
- Social sharers need easy sharing mechanisms
A/B Testing and Experimentation
Systematic testing transforms assumptions into evidence:
Layout Optimization:
- Featured content placement variations
- Navigation structure alternatives
- Call-to-action positioning
- Color scheme and contrast testing
Content Strategy Testing:
- Long vs. short biographical formats
- Video vs. photo gallery emphasis
- Chronological vs. thematic organization
- Search vs. browse navigation priority
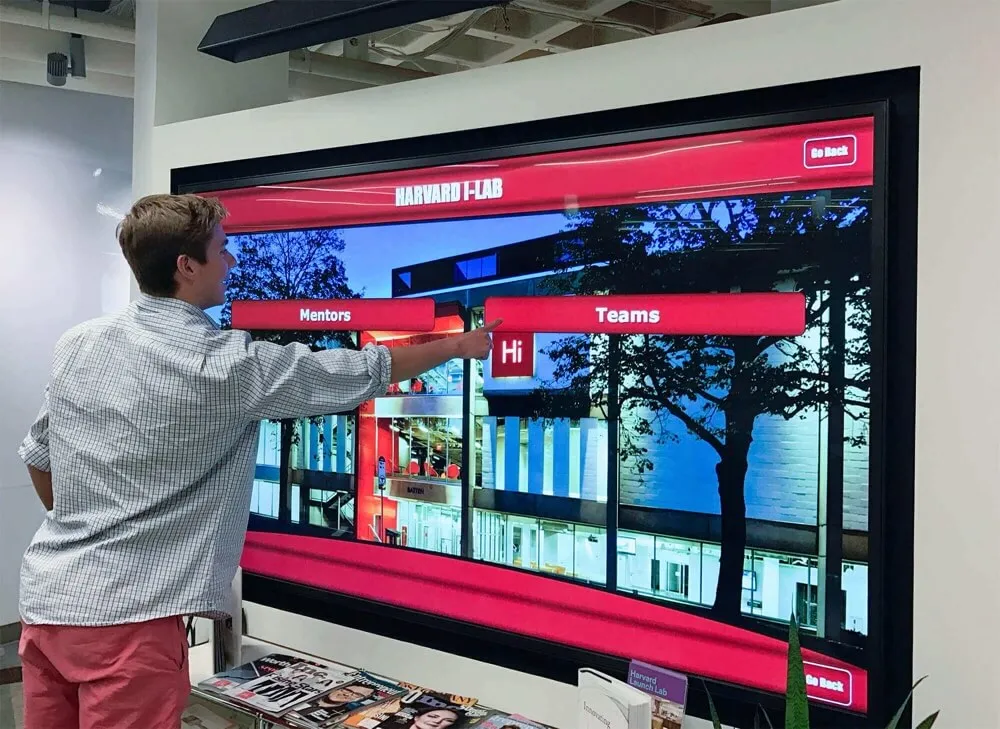
Platforms like Rocket’s interactive kiosk software often include A/B testing capabilities, enabling evidence-based optimization without technical complexity.

Attribution Modeling
Understanding multi-touch engagement journeys reveals how recognition fits into broader relationship development:
Touchpoint Mapping:
- Initial awareness (event, referral, promotion)
- First interaction with display
- Return visits and deepening engagement
- Conversion events (donation, registration, update)
Engagement Scoring: Assign point values to different interactions based on intensity:
- Profile view: 1 point
- Video watched completely: 3 points
- Search conducted: 2 points
- Profile update submitted: 5 points
- Donation made: 10 points
Cumulative scores identify highly engaged individuals for targeted outreach.
Demonstrating ROI to Stakeholders
Analytics only create value when insights drive decisions and secure stakeholder support.
Creating Compelling ROI Narratives
Quantitative Foundations:
- Direct cost savings vs. traditional displays
- Operational efficiency gains
- Measurable engagement increases
- Fundraising correlation data
- Recruitment impact statistics
Qualitative Enhancements:
- Testimonials from engaged alumni
- Success stories of reconnections
- Student inspiration examples
- Community pride indicators
The most persuasive ROI presentations combine both, showing numbers supported by human impact.
Audience-Specific Reporting
For Executive Leadership
- Strategic value and competitive positioning
- Financial returns and resource optimization
- Institutional goal alignment
- High-level summaries with details available
For Development Teams
- Engagement metrics and relationship growth
- Fundraising correlations and donor feedback
- Pipeline development indicators
- Cultivation effectiveness measures
Tailor presentations to stakeholder priorities, emphasizing metrics most relevant to each audience.
Visualization Best Practices
Dashboard Design Principles:
- Trend lines showing improvement over time
- Year-over-year growth percentages
- Before/after comparison bars
- Key statistics in large, readable formats
- Balanced quantitative and qualitative elements
Storytelling with Data: Numbers alone rarely persuade. Combine metrics with narrative context that explains significance and implications.
Continuous Improvement Frameworks
Analytics value compounds through systematic optimization cycles.
The Measurement-Optimization Loop
Four-Step Improvement Cycle
1. Measure: Collect comprehensive data across all relevant metrics
2. Analyze: Identify patterns, anomalies, and opportunities
3. Hypothesize: Develop evidence-based improvement theories
4. Test: Implement changes and measure impact
Organizations embracing this continuous improvement mindset typically see sustained engagement growth of 10-15% annually while those implementing displays without ongoing optimization plateau after initial enthusiasm fades.
Common Optimization Opportunities
When session duration is below benchmarks:
- Enhance visual design for stronger first impressions
- Add prominent navigation cues
- Introduce featured content recommendations
- Incorporate interactive discovery elements
When return visit rate is low:
- Increase content update frequency
- Add “What’s New” highlights
- Create notification systems for interested alumni
- Implement changing featured content
When specific categories underperform:
- Review content quality and media richness
- Consider better promotion through featured placements
- Add diverse examples within that category
- Survey stakeholders about content preferences
Solutions like those available at data-driven recognition platforms make implementing these optimizations straightforward even for non-technical teams.
Conclusion
Advanced analytics transform digital recognition from static investment to dynamic engagement platform. By implementing the measurement frameworks, techniques, and optimization strategies outlined in this guide, organizations move from intuition-based decisions to evidence-driven strategies that maximize both engagement and return on investment.
The institutions achieving greatest success with digital recognition aren’t necessarily those with largest budgets or most elaborate systems. They’re organizations that systematically measure performance, learn from data, and continuously refine their approach based on evidence.
Start with core engagement and content metrics. As your measurement practice matures, expand into strategic impact analysis and predictive analytics. Most importantly, ensure measurement efforts drive action—data without decisions creates no value.
Ready to implement a digital recognition system with sophisticated built-in analytics? Rocket Alumni Solutions provides platforms specifically designed for measurable recognition excellence, with intuitive dashboards that make tracking success simple and actionable.
Effective measurement is the difference between justifying an expense and demonstrating an investment. Start tracking today, and let the data guide your path to recognition excellence.